2) Consultation results
This is page 3 of a 7 page report. View the report contents or download the full Consultation and Engagement Report (PDF, 2,289kB).
2.1 The shape of the conversation to date
The University led the engagement through both real-time hybrid (i.e. both online and in person) conversation events, and a survey. These engagements, along with written responses all formed part of the data set to help inform a decision making process.
The two initial community workshops, held on 5 December 2022 and 25 January 2023, which included presentations on the Legacies of Slavery report, panel discussions and reflections from attendees broadly reflected the range of arguments set out in Section 3.1 below. There was a mix of testimony from University staff and students and with real time comments from members of the wider community. Recordings of these events are available online8 and testimony will be considered by the University as part of their deliberation process.
For the survey, which received 3,670 responses, the University sought both quantitative and qualitative responses from the community. This method seeks to ensure an understanding of the motivations and strength of feeling of respondents is underpinned by data, where data alone cannot tell us why a respondent answered in the way they did.
As an example, where the survey asks whether a respondent supported the renaming of a university building, the ‘yes/no’ format of the response tells us nothing about the reasons the respondent might choose ‘no’. The qualitative, free text responses are more revealing of the motivations, which might range from ‘I am more concerned about the impact of contemporary structural racism than the names of buildings’ to ‘erasing history condemns us to repeat the same mistakes’ to ‘the individuals in question deserve to be honoured as philanthropists’ etc.
Two separate technical reports compiled by Alterline and the Jean Golding Institute analysed the qualitative and qualitative data, respectively. The findings of these reports are summarised below.
2.2 Quantitative data
Overall the survey data highlighted the deep polarisation of views about renaming across different demographics and communities. Feedback identified from within the survey but also shared directly with the University, and analysis of the survey data, highlighted how some respondents felt unable to reflect their views accurately which resulted in inconsistencies with how questions were answered. Whilst this contributed to the lack of conclusive quantitative data it unintentionally provided a rich source of more insightful qualitative data.
Summary of the quantitative survey data
- 3,670 responses were received from students (43%), staff (23%), alumni (17%), the Bristol public (10%) and people from outside Bristol (5.3%)
- A significant majority (67.1%) of the responses were received from people who identified as White English, Northern Irish, Scottish, Welsh or British
- Black respondents were more likely to favour retention of existing building names than White respondents, though the sample of Black respondents was small compared to White respondents.
- Mixed or Multiple ethnicity respondents were more in favour of changing building names with a 55% / 45% split.
- Black respondents and Mixed / Multiple ethnic groups were more likely to report a ‘major’ or ‘moderate’ impact of building names on them than other respondents.
- Younger generations and current members of the University are more likely to show support for renaming than older respondents, alumni and members of the wider community.
A significant majority (67.1%) of the 3,670 responses were received from people who identified as White English, Northern Irish, Scottish, Welsh or British. 12.7% declined to give a response, and the other ethnicity groupings were Mixed/Multiple ethnic (5.8%), Asian/Asian British (5.4%), Black / African / Caribbean / Black British (3.9%), Unknown (3.1%) and Other (2%).
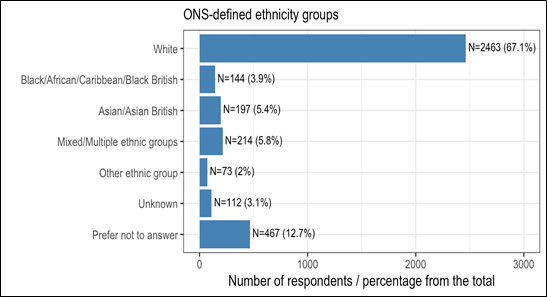
- White: 2,463 respondents (67.1%)
- Black/African/Caribbean/Black British: 144 respondents (3.9%)
- Asian/Asian British: 197 respondents (5.4%)
- Mixed/Multiple ethnic groups: 214 respondents (5.8%)
- Other ethnic group: 73 respondents (2%)
- Unknown: 112 respondents (3.1%)
- Prefer not to answer: 467 respondents (12.7%)
If the proportions of these ethnic groupings were to be compared with Bristol’s population statistics, the most underrepresented group in ethnicity terms in the survey would be White British although the vast majority of the respondents were in that category. However, some of the responses originated from outside the city, including internationally.
The greatest number of respondents originated from the student body, but staff were also well represented with nearly 850 staff responding. 620 Alumni also responded, plus 576 members of the public, nearly 200 of which responded from outside Bristol.
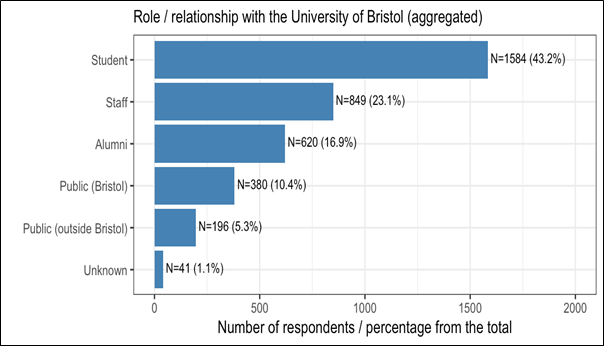
- Student: 1,584 respondents (43.2%)
- Staff: 849 respondents (23.1%)
- Alumni: 620 respondents (16.9%)
- Public (Bristol): 380 respondents (10.4%)
- Public (outside Bristol): 196 respondents (5.3%)
- Unknown: 41 respondents (1.1%)
The quantitative data demonstrate a complex picture of polarized viewpoints in terms of the ethnicity of respondents, their age and their relationship with the University. Looking at the data in simple terms, those that were broadly in favour of retaining the existing names of the University’s buildings were 54% in favour compared to 43% against.
This split was more pronounced in the responses of Black people, who made up 5% of the total sample, with 67% against making changes to building names compared to 33% in favour. However, sample sizes were very different at 2,463 and 144 respectively. Additionally, there were a total of 628 respondents with a non-White ethnicity and a further 467 who preferred not to say.
The single ethnicity grouping most impacted by the names of the University’s buildings was Black/African/Caribbean/Black British people, with 49.4% stating the University’s building names had a major or moderate impact on them. However, 34% of Black respondents reported no impact.
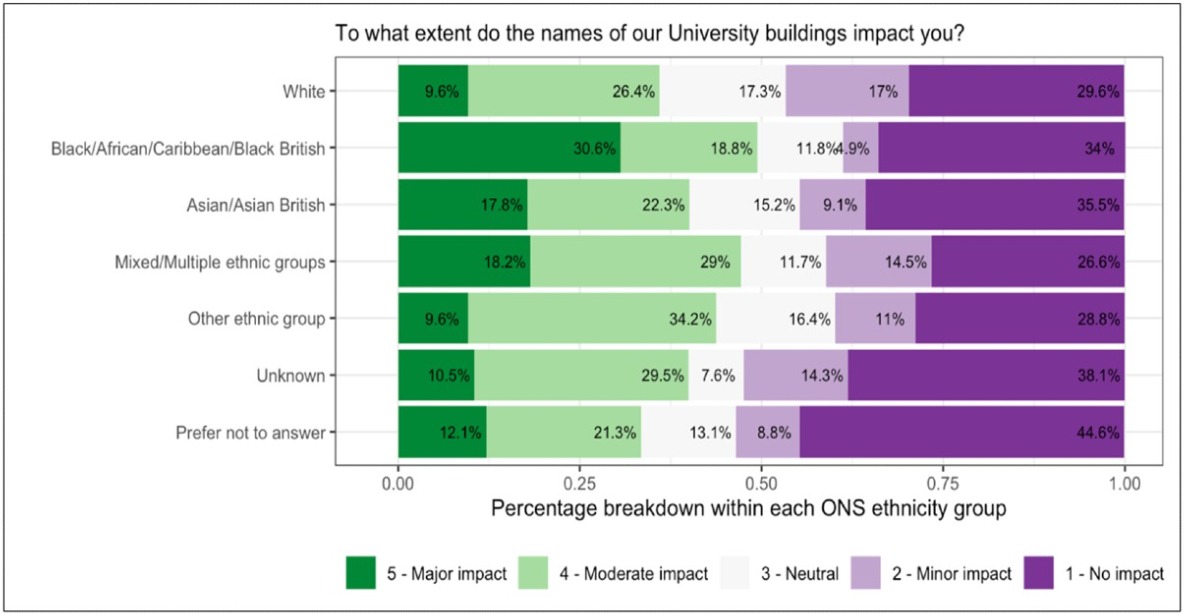
- White. Major impact: 9.6%. Moderate impact: 26.4%. Neutral: 17.3%. Minor impact: 17%. No impact: 29.6%
- Black/African/Caribbean/Black British. Major impact: 30.6%. Moderate impact: 18.8%. Neutral: 11.8%. Minor impact: 4.9%. No impact: 34%
- Asian/Asian British. Major impact 17.8%. Moderate impact: 22.3%. Neutral: 15.2%. Minor impact: 9.1%. No impact: 35.5%
- Mixed/Multiple ethnic groups. Major impact 18.2%. Moderate impact: 29%. Neutral: 11.7%. Minor impact: 14.5%. No impact: 26.6%
- Other ethnic group. Major impact: 9.6%. Moderate impact: 34.2%. Neutral: 16.4%. Minor impact: 11%. No impact: 28.8%
- Unknown. Major impact: 10.5%. Moderate impact: 29.5%. Neutral: 7.6%. Minor impact: 14.3%. No impact: 38.1%
- Prefer not to answer. Major impact: 12.1%. Moderate impact: 21.3%. Neutral: 13.1%. Minor impact: 8.8%. No impact: 44.6%
The data demonstrate a strong correlation between those that felt a building name had a major or moderate impact on them and those that believed a building should be renamed. If the University determined that responses from communities affected by legacies of slavery should be given more significance than those that are not, it could weight its determination according to how Black communities say building names impact them. As we have seen views are split on this issue and no particular course of action is clear.
Alternatively, the University could weight its determination on the basis that a major or moderate impact on the 49.4% of Black respondents is the overriding factor, on the assumption that those that report no impact are likely to be indifferent to any change of name.
It may not be appropriate to make this assumption, however. Some respondents attributed a high importance to renaming, even where they said the building name has a low or minor impact on them, possibly advocating on behalf of others they believe may be impacted. Equally the data show that some respondents reporting that the University’s building names had a major impact on them placed a low importance on renaming the buildings.
Looking at the same data against the respondents’ relationship to the University shows a clearer picture of the split in opinion, with younger people and current members of the University favouring renaming over older people, alumni and members of the wider Bristol community:
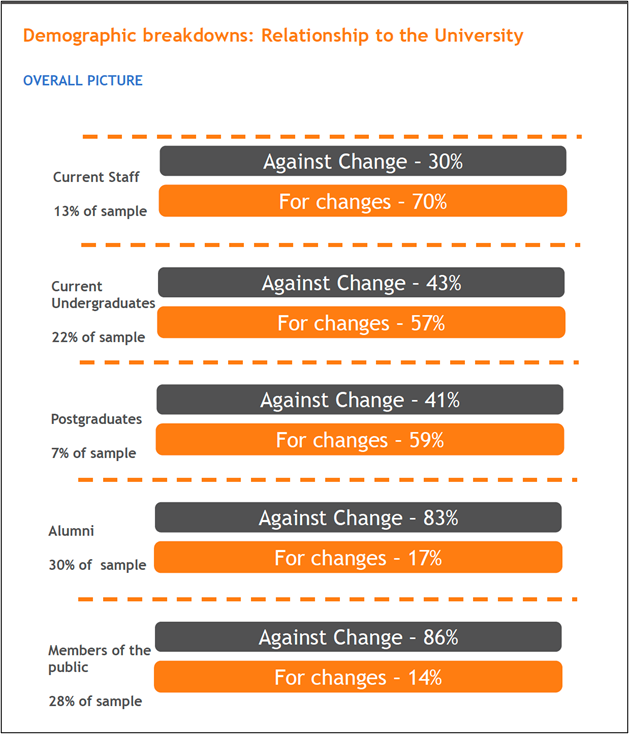
- Current staff. 13% of sample. Against change: 30%. For changes: 70%
- Current undergraduates. 22% of sample. Against change: 43%. For changes: 57%
- Postgraduates. 7% of sample. Against change: 41%. For changes: 59%
- Alumni. 30% of sample. Against change: 83%. For changes: 17%
- Members of the public. 28% of sample. Against change: 86%. For changes: 14%