Each year the Government and the media publish league tables of schools’ academic performances and encourage parents to use them when choosing a secondary school for their children. Our work shows that these tables are highly misleading when it comes to school choice.
The most high profile measure – the percentage of children getting five A* to C grades at GCSE – says more about the differences in schools’ intakes than it does about the differences in their quality;
Value-added measures are superior in that they adjust for these initial differences, but deriving from approximately 200 students per school, are so noisy that it is hard to statistically separate many schools’ performances from one another;
Just as with stocks and shares, schools’ value-added past performances are not reliable indicators of their future performances and crucially it is these future performances which are relevant when choosing a secondary school.
More should be done by the Government and the media to communicate these important limitations to parents.
Our work focused on a fundamental problem in using school league tables for school choice: School league tables report the past performance of secondary schools, based on children who have just taken their GCSE exams, whereas what parents want to know is how schools will perform in the future when their own children take the exams. Consider parents who chose a secondary school for their child in autumn 2012. Their child will enter school in autumn 2013 and will take their GCSE exams in 2018. Thus, the information parents need when choosing is how schools are predicted to perform in 2018. However, the most recent information available is the school league table for how schools performed in 2011. Thus, there is a seven year gap between the available information and what parents want to know; the most recent league table is always effectively seven years out of date.
We focused on the Government’s ‘contextual value-added’ (CVA) league tables as the Government promoted these as being the most meaningful way to compare schools. Clearly, the more schools’ CVA performances change over a seven year period, the less reliable school league tables will be as a guide to schools’ future performances. We examined the official school league table data and showed that many schools which were performing in the top quarter of schools in 2002 were below average seven years later. We then proceeded to illustrate just how unreliable the current school league tables are by predicting schools’ current performance using data from seven years previously. These predictions are so imprecise that almost no schools can be distinguished reliably from one another. This means that, for choosing a school, the league tables are essentially meaningless and, by not communicating this fundamental problem to parents, they are highly misleading.
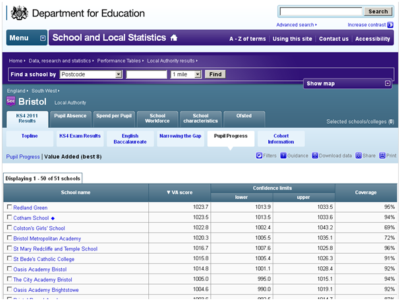
Government 2011 School League Table - Value-added scores of Bristol schools
References for practitioners, journalists, and policy-makers
Leckie, G. and Goldstein, H. (2009). School league tables: Are they any good for choosing schools? Research in Public Policy, Bulletin of the Centre for Market and Public Organisation, 8, 6-9.
Goldstein, H. and Leckie, G. (2008). School league tables: what can they really tell us? Significance, 5, 67-69.
References for academics
Leckie, G. and Goldstein, H. (2009) The limitations of using school league tables to inform school choice. Journal of the Royal Statistical Society: Series A, 172, 835-851.
Leckie, G. and Goldstein, H. (2011). Understanding uncertainty in school league tables. Fiscal Studies, 32, 207-224.
Dr George Leckie, Professor Harvey Goldstein
g.leckie@bristol.ac.uk
Assessment and Evaluation; Multilevel Modelling; Quantitative Methods