New features in MLwiN 2.1
- See also new features in MLwiN 2.18
Three main new features:
1. Improved model specification interface
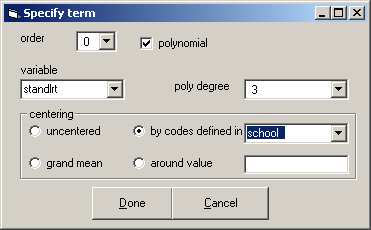
When variables and interactions were created in previous versions recoding main effects (changing centering or reference categories) did not update the interactions involving these changed variables. Interactions + main effects had to be removed from the model, main effects re-coded and then main effects and interactions re-entered. This can be a time consuming and error prone process. In the version 2.02, polynomials are created by specifying an optional order. If polynomial order, reference category(for a categorical variable) or centering value for a main effect is changed all associated interactions are updated.
The Specify Term window used to add terms and interactions into the model has been updated to include this extra functionality
How do you delete a column of data in MLwiN?
In the new version this is easy, there is a button to do this in the names window
2. Bespoke Predictions Window
The current predictions window only predicts for values in the data set. Often we want to generate predictions for a specific (bespoke) set of explanatory variable values to best explore multidimensional model predictions space.
The bespoke predictions window allows users to specify a range of values for each predictor variable and a prediction data set is created containing all combinations of these variables. Values of all interaction terms in the model can of course be automatically derived and need not be specified. Model predictions (and confidence intervals) are then calculated for the generated prediction data set. Another plot-specification window then facilitates specification of visulations of the prediction data set in up to 4 dimensions of predictor variable via use of colour coding and plot trellises.
Where the response is discrete, predictions can be on the link scale eg log, logit, complementary loglog, or the natural scale probability, count etc. This automation is particularly useful for multinomial models where calculating probabilities for each response category as a function of explanatory variables along with intervals is tricky.
Predictions may be cluster specific or population average allowing users the ability to visualise and explore the consequences of these two different model assumptions.
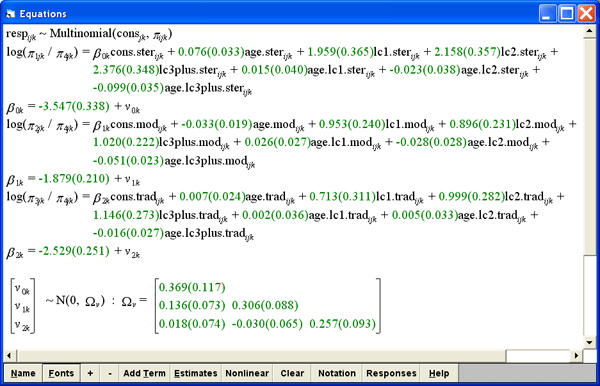
For example, below is a 2 level multinomial model from the MLwiN user guide. The model compares odds of using different types of contraception sterilised, modern or traditional against a common reference no contraception. These odds are modelled as functions of : number of previous children (lc0, lc1, lc2, lc3+) the age of the women (age) and the interaction of these two variables.
The bespoke predictions window for this model, looks like this:
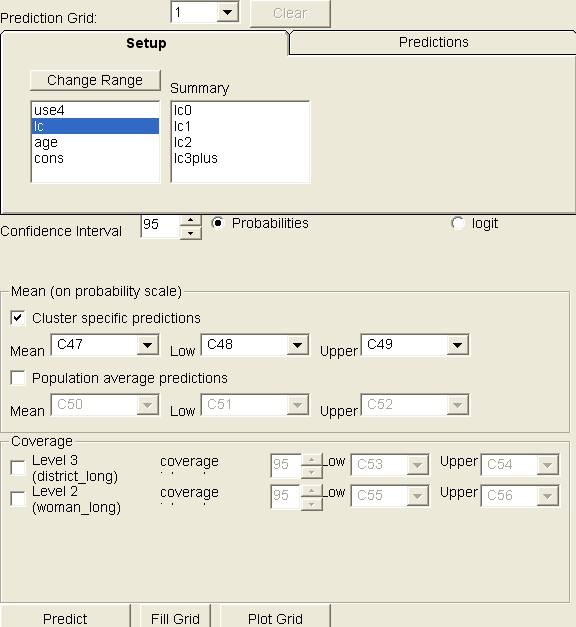
The top panel labelled setup allows specification of explanatory variable values for the bespoke prediction grid. The lower screen allows specification of a percentile value for confidence and coverage intervals around predictions; whether predictions should be on the logit or probability scale; whether predictions are to be cluster specific or population average, and the final portion of the screen also allows coverage intervals based on between district variation to be optionally included.
A plotting window allows flexible specification of how the prediction results are to be plotted
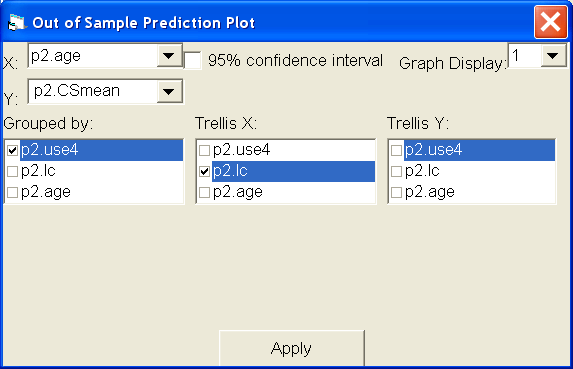
For example, here we ask for the x variable to be age, the 4 response types to be grouped together on each graph and the different levels of lc (#of kids) to be placed on a vertical trellis.
Pushing Apply creates:
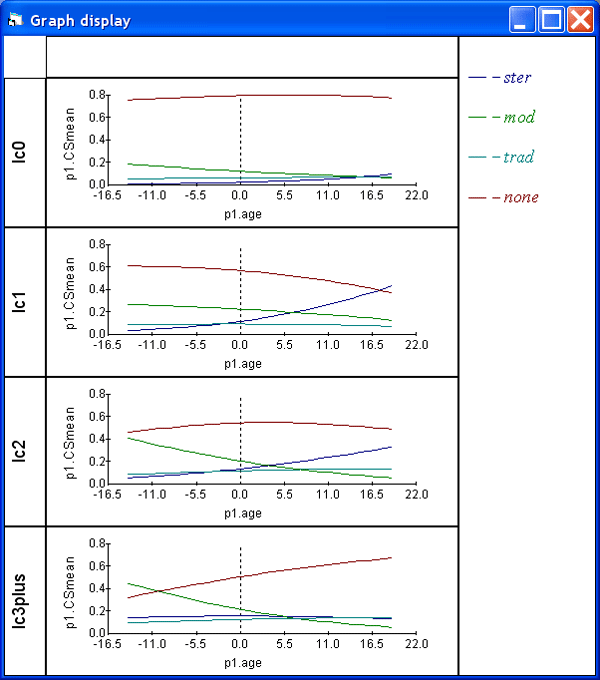
Similar bespoke prediction and visualisation functionality exists for Normal, Poisson, Binary and negative binomial models.
3. Surface Plotting
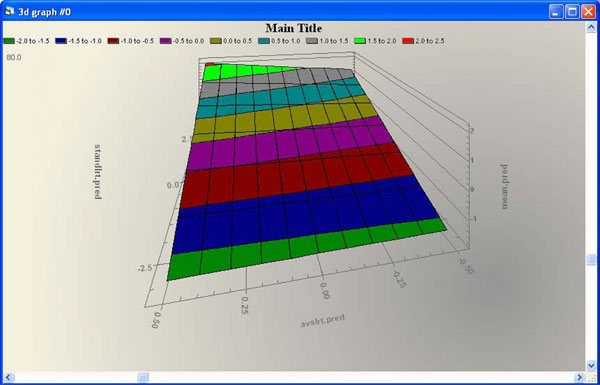
Some basic surface plotting and rotation functions have been added. For example, below is a rotatable surface plot of the interaction between 2 continuous variables:
