Spatiotemporal patterning of T cell activation
To investigate the spatiotemporal organisation of T cell signalling in a physiologically relevant context, we activate murine TCR transgenic T cells ex vivo with professional APCs and antigenic peptide and culture them five days with IL-2. We then study the interaction of such ‘primed’ T cells with professional APCs in vitro. Performing experiments in T cells expressing a TCR transgene enables the engagement of the TCR by its natural ligand peptide-MHC complex, whereas the use of professional APCs provides ligands to as many costimulatory receptors as possible. Various fluorescent molecules that report on the localisation of a specific element of T cell activation, ‘sensors’, are expressed in the primed, primary TCR-transgenic T cells by retroviral transduction. Sensor-transduced T cells are sorted by flow cytometry such that only those cells within a 5-fold range of low abundance of GFP, which matches the high end of microscope sensitivity, are collected. As determined by quantitative Western blotting this corresponded to a concentration of 2 - 5 µM. Using this sorting strategy across a range of actin regulators, the combined concentration of endogenous protein plus its retrovirally expressed GFP-tagged version as an imaging sensor was commonly within the 5 to 95 percentile of the endogenous protein concentration (Roybal et al., Sci. Signal., 9, rs3).
To image the spatiotemporal distributions of the sensors, transduced T cells are reactivated by incubation with APCs that have been exposed to the appropriate antigenic peptide (10µM for the data shown here). The distributions of sensors are determined in 3 dimensions as a function of time (image acquisition every 20s for 15min). This time range coincides with the peak of biochemically detectable signalling. This is also the time frame of the translocation of the critical transcription factors NFAT and NFκB to the nucleus, thus linking signalling to the initiation of a transcriptional response.
As our basic form of image analysis, we determine spatiotemporal patterns (described in detail in Singleton et al., Sci. Signal., 2 ra15). Any accumulation of a sensor at ≥ 135% of the background cellular fluorescence is classified into seven spatial patterns at 12 time points, resulting in a patterning figure as displayed on the molecule pages. The six, mutually exclusive interface patterns (PDF, 684kB) (opens a pdf document, size 685 kb) represent cell biological structures driving signalling organisation. They are: accumulation at the centre of the T cell-APC interface in a large protein complex (central), accumulation at the interface periphery where F-actin drives interface spreading and individual lamella (peripheral and asymmetric, respectively), accumulation in a large T cell invagination (invagination), accumulation in a broad interface lamellum, a transient F-actin sheet with embedded signalling complexes shaped by a highly undulating cellular interface (lamellum) and cortical accumulation that covers central and peripheral regions, an intermediate pattern that is less well defined in cell biological terms (diffuse). In addition, accumulation opposite the interface at the T cell distal pole (distal) is scored separately. The same imaging data can also be analysed comprehensively using computational image analysis to generate three-dimensional maps of local concentrations with thousands of voxels per cell (as described in Roybal et al., Sci. Signal., 9, rs3). Corresponding data are held on a different website: murphylab.web.cmu.edu/data/TcellModels/.
For a graphical overview over the entire data set derived from the interaction of 5C.C7 T cells with CH27 B cell lymphoma APCs, we use the frequencies of pattern occurrence for each sensor to generate a heat map (PDF, 88kB). The frequencies of pattern occurrence also constitute the input data for a cluster analysis to determine how closely the spatiotemporal patterns of different sensors are related. The tree diagram can be found next to the heat map (PDF, 88kB).
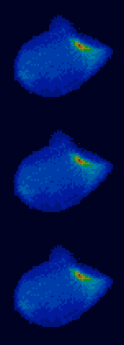
For each individual molecule, we provide a page listing the sensor, the patterning graph, and a representative movie. The data are derived from the interaction of 5C.C7 T cells with CH27 B cell lymphoma APCs. In some cases data on the activation of DO11.10 TCR transgenic T cells with A20 B cell lymphoma APCs are also available. The patterning graph shows the percentage of cell couples that display accumulation of signalling intermediates with the indicated patterns relative to tight cell couple formation for the sensor-transduced T cells. For sensors with predominant internal, likely vesicular accumulation the position of the majority of the sensor was determined by dividing the T cell into three sections of equal length along the cellular axis parallel to the direction of cell movement (excluding the uropod because of its greatly varying length) or perpendicular to the interface (1, 2, or 3 with increasing distance from the leading edge of the T cell or the interface). The population-averaged position is given as a function of time. In the representative movies, differential interference contrast (DIC) images are shown on top, with top-down, maximum projections of 3-dimensional sensor fluorescence data on the bottom. Sensor fluorescence intensity is displayed in a rainbow-like false-colour scale (increasing from blue to red). The movies are in mp4 format.
Molecule data are only included on this website after their publication. Molecules where data have been fully acquired and analyzed but not published yet are only listed. Please contact us directly for data access.
- Actin
- ADAM10
- ADAP
- Akt
- Arf6
- Arp3
- Capping Protein α1
- CD2/CD48
- CD28/CD86
- CD2AP
- CD6
- Cdc42
- Chronophin
- Cin85
- Cofilin
- Coronin 1A
- CTLA-4
- CXCR4
- DAG
- Ezrin
- GRB2
- HS1
- Itk
- LAT
- Lck
- LFA-1/ICAM-1
- Ly108
- Lysotracker
- Moesin
- MLCK (Myosin light chain kinase)
- MTOC
- Myosin 1C
- Myosin II
- Nck
- NFAT
- NFkB
- Pacsin2
- PD-1
- PI 3-kinase
- PIP
- PIP2
- PIP3
- PIP 5-kinase
- α-Pix
- PKC ζ
- PKC η
- PKC Θ
- PLC γ
- Rac
- Rho
- Rltpr
- Rpre
- SAP
- SHP-1
- SKAP-55
- SLAT
- SLP-76
- STIM-1
- TCR/MHC (TCR ζ, CD3 ε, MHCII)
- TCR mutants
- Tec
- Themis
- TRAIL
- Transferrin
- VASP
- Vav1
- WASH
- WASP
- WAVE2
- WDR34
- ZAP-70