Research Software Engineering to reduce the environmental impact of a long-running script
The Research Software Engineering (RSE) Group worked with Dr Gary Barker, a Senior Lecturer in the School of Biological Sciences, to speed up a Perl script that he developed to find the minimal set of genetic markers needed to differentiate all samples in a genotyping dataset. After 10 days of work, the software was accelerated by over 25,000 times (figure 1). This reduced the runtime for identifying the minimal set of markers to distinguish different varieties of wheat from about 10 days to just 34 seconds! This benefits both Gary’s work, enabling him to routinely process very large data sets, and it benefits the environment. Significantly less electricity is required to run the newly optimised script and optimisation has removed the need for Gary to invest in a dedicated server that would be left running for days. Quoting Gary:
“We are really excited about the improvement in speed and the reduced carbon footprint of the re-designed code. With our existing datasets it's great to results in minutes that previously took weeks to obtain, but this actually opens up new avenues of research now that we can start looking at millions of genetic markers across whole genomes rather than focussing on just a few tens of thousands at a time.”
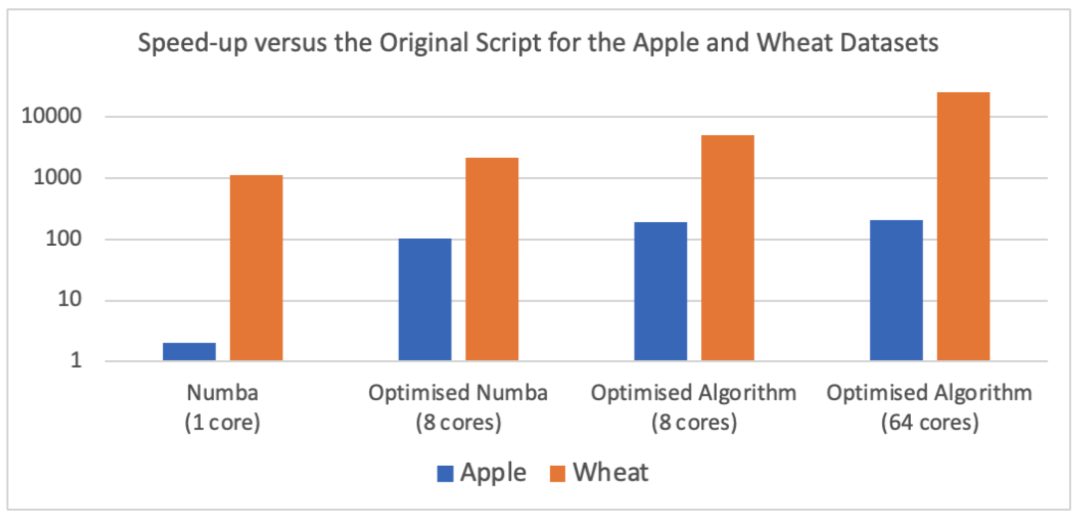
Figure 1: Speed-up of the optimised script versus the original script for the Apple and Wheat datasets, during different stages of the RSE’s work, as described in this report. Performance was measured relative to that of the single-core Perl script on an Apple M1 (1 core and 8 cores) and an AMD EPYC 7J13 (64 cores).
What was the problem?
The original script, select_minimal_markers.pl, is a well-written piece of Perl that can be used to identify the minimal set of genetic markers needed to distinguish all samples in a genotyping dataset. For example, the software was used early on to select markers to ID SARS-Cov2 lineages. There are two datasets that were used when developing the original Perl code: Apple and Wheat. The Apple dataset was smaller (1285 markers to distinguish between 260 varieties) and takes about 2 minutes to process on a laptop. The Wheat dataset is large (~35k markers to distinguish between 2044 varieties) and takes around 10 days to process. While it is ok to take a couple of minutes, it is not sustainable to keep a laptop running for days to run a script to process larger datasets. The speed of the Perl script was hampering research, so Gary approached the RSE group to see if there was anything they could do to help.
Porting to Python
An RSE was assigned to look at the script and to see what could be done. While Perl can be a great language for genetic analysis, there are few options available to radically speed up Perl scripts or parallelise them to take advantage of multiple processors. The RSE decided, as a first step, to perform a quick port of the script to Python. The Perl script was well-structured and cleanly documented, so porting took less than a day. The RSE took care to load data into numpy arrays, but even with this, the Python port was over 10 times slower than the original Perl code! The Python port took 21 minutes to process the Apple data set, compared to 2 minutes for Perl. At first glance, it appeared that the RSE was going backwards!
Accelerating with numba
There was a method in the madness. The RSE knew that a key benefit of Python is that there are lots of options to accelerate and parallelise scripts. For example, Python can be compiled to machine code using tools like cython, numba and mypyc. For this project, numba was chosen as it involves just-in-time compilation when the script is running. This keeps distribution simple, as you don’t have to worry about pre-compiling and distributing executables. With numba, the code is still as portable and easily shareable as a normal Python script.
Using numba can be as simple as adding @numba.jit decorators to functions that you want to accelerate. This marks these functions for compilation, which numba performs at runtime via a bundled LLVM compiler. For numba to work efficiently, the functions should be mostly loops operating on numeric data. Fortunately, most of the select_minimal_markers.py script is loops working on numeric data held in NumPy arrays, so this was a good fit. Adding the @numba.jit decorators took almost no time to code and sped up the Python port by 20 times. The total run time (62 seconds) was now half the 126 second runtime of the original Perl script.
Optimising and parallelising
The RSE spent a few more hours making further optimisations to the code. These improved the way that data was held in memory and how it was accessed. Specifically, the original Perl code involved lots of movement of data between string and integer types. This was copied over to the Python port. With deeper knowledge of the algorithm now gained, the RSE was able to refactor the Python code so that it worked with integers only. This enabled numba to better optimise the loops. In addition, parallelisation was added via numba’s prange function. This enabled the loops to be compiled with OpenMP parallelism, so that all eight cores of the RSE’s laptop could be used. With these changes, the Apple data set was processed in just 1.9 seconds. Of this, a third was the just-in-time compilation of Python to machine code. This compilation can be cached by adding the cache=True option to numba.jit. With caching, processing of the Apple data set took just 1.2 seconds – over 100 times faster than the original Perl code!
Scaling to a larger dataset
The Python script was now so fast on the Apple dataset that further optimisation was difficult. Attention was switched to the larger Wheat dataset. This dataset is 134 MB in size and takes about 10 days to process using the original Perl script. As it stood, the Python script took about 780 seconds, so was about 1000 times faster. However, the RSE believed that there was still scope for improvement.
The first challenge was that the Python functions used to read in and then parse the data into the correct format were too slow, taking minutes. This made testing and profiling of the code cumbersome, so a few hours effort was spent to optimise this process. Profiling showed that data formatting was the bottleneck, so the code was rewritten to read all data in as a block, and to then parallelise and optimise the formatting code. With this, a complete read and parse took about 8 seconds. The code was then further optimised by breaking parts out into more easily decomposable functions and paying more attention to how to get the best out of numba. Over a period of five days the RSE worked to increase the speed of the code until, eventually, the total Wheat data set could be processed in 62 seconds (a speed-up of nearly 14,000 times compared to Perl!). Part of this speedup was gained by optimising the parallelisation so that the code scaled well on a 64-core server. On the RSE’s laptop the code took about 400 seconds to run (about 2000 times faster).
Changing the algorithm
Porting and optimising the code gave the RSE a great insight into the algorithm used to find the minimal set of markers. This insight led them to realise that a lot of the calculation was unnecessary, as a complete scan of all the markers for each iteration was redundant. The algorithm works by selecting, at each iteration, the marker with the highest score. As each marker is selected, the scores of the remaining markers need to be recalculated. However, the RSE realised that the score for each marker could only decrease from one iteration to the next. The code could be sped up by scanning markers in order of decreasing score as calculated from the previous iteration. If the score of a marker from a previous iteration was already less than the highest score from the current iteration, then the best scoring marker had already been found. No more scores needed to be calculated, and the iteration could be exited early, with the rest of the markers skipped.
Implementing this algorithm required a significant change to the layout of the program. Fortunately, Python, like Perl and other scripting languages, is “low code.” As such, it was extremely easy to experiment and make substantial changes while only writing a small number of lines of code. The new algorithm was implemented and tested within a few hours during a single day. The result was that the runtime for the Wheat data set reduced to just 34 seconds on the 64-core server, and just 171 seconds on the RSE’s laptop (a speed-up of over 25,000 times and 5000 times respectively compared to the original Perl script). On the smaller Apple dataset, processing on the laptop took just 0.65 seconds.
Making the code more robust, reproducible, and sustainable
In addition to optimising the code, part of an RSE’s role is to add the “software engineering goodness” that improves a code's robustness, reproducibility, and sustainability. To this end, the RSE added both run-time and integration / regression tests to the optimised script. As the code was now so fast, it made sense for additional calculations to be added that verified the result. To start, the maximum possible number of distinguished varieties was calculated by selecting all markers. This gave the target value that the minimal-selection algorithm should be able to reach. Then, after the calculation of the minimal set, the selection matrix was recalculated from scratch. This recalculation verified that the individual scores from each selected marker matched what was found during the iterations, and that the final number of distinguished varieties matched the maximum possible as calculated at the beginning of the run. These run-time tests give high confidence that the script would work correctly for any input data set. These run-time tests effectively included functionality that was provided via a check_results.pl script that was originally used to check the output of the original program.
To further validate and retain confidence in the code, an integration / regression test was added that checked that the minimal markers selected by the original program (together with their scores) were also selected by the optimised program. This test_minimalmarkers.py script could be run either directly or via a tool such as pytest. This integration / regression test gives confidence that the code will continue to work correctly and reproducibly, at least for the Apple dataset.1 To ensure this test was run regularly, a GitHub Actions workflow was added to perform continuous integration across multiple versions of Python on Windows, Linux and MacOS.
To make the code more sustainable, lots of documentation was added. This included documentation of the code itself, which had been cleaned and structured in a more friendly manner. User documentation was added, based on the Apple dataset as an example, to allow new users to quickly learn how to use the program. Example output from running the program was included so that users could also see what the output should look like. Documented command-line arguments were added via the Python argparse module. These replaced the hard-coded parameters in the original script and provided a more user-friendly way to tweak parameters that affected the calculation. Next, the convert_vcf_to_genotypes.pl, script, which was used to convert standard VCF files into the input filetype needed by the original script, was ported to the optimised script as an extra function. This was invoked via a --vcf option added to the program, thereby enabling users to directly load data from VCF format, without having to change format as an initial step. To cap this off, a CONTRIBUTORS.md file was added to provide credit for the contributors to the program, and to provide a warm welcome to anyone who would be thinking about contributing. A LICENSE.md file was added that gave the license terms for how the script would be shared, and under what terms new contributions would be accepted. And a requirements.txt was added to specify the small number of dependencies of the optimised script.
Finally, to make the script more useful for others, it was modified so that it could be imported and used as a module as part of a larger program. The core functions used by the script were exposed as part of its public API, and these were cleanly documented. The script was renamed to match the name of the module (minimalmarkers.py), and the documentation updated to make it clear that the script could be run directly from the command line, or it could be imported and used via the API (for example, in a Jupyter notebook or as part of the larger program).
Conclusion
With a little support from a Research Software Engineer, the minimalmarkers software has been significantly optimised, and made more robust, sustainable, and reproducible. The results will benefit research, while also reducing the environmental impact of running the minimalmarkers software.
Appendix
The original code, plus all further changes, were developed and tracked on GitHub. In total, the work took 10 days of effort from the RSE (9th, 10th, 13th, 15th, 16th, 20th, and 21st December, plus the 5th, 6th, and 7th January). Key versions of note are
9th December 2021: Original version of the Perl code
10th December 2021: First version of the Python code that reproduced the Perl code
10th December 2021: Python version using numba that was significantly quicker
21st December 2021: Fully optimised code before the change in algorithm
5th January 2022: Fully optimised code that uses the new algorithm
7th January 2021: Code with finished docs, tests, and renamed to be loaded as a module