Residuals in MLwiN
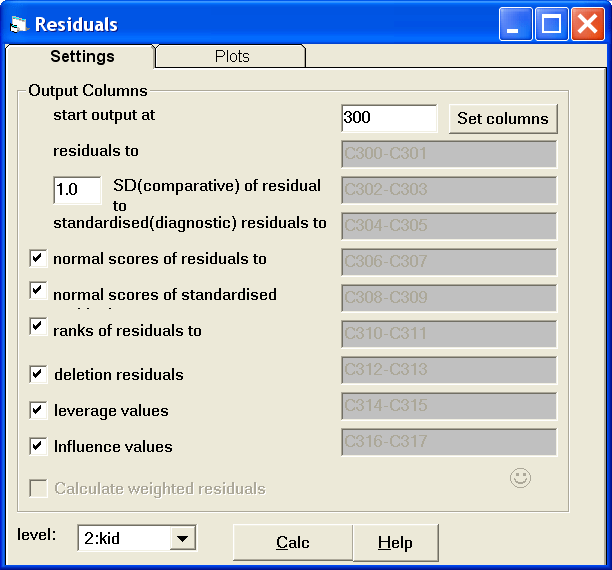
Residual (shrunken) estimates can be computed along with a range of diagnostic information:
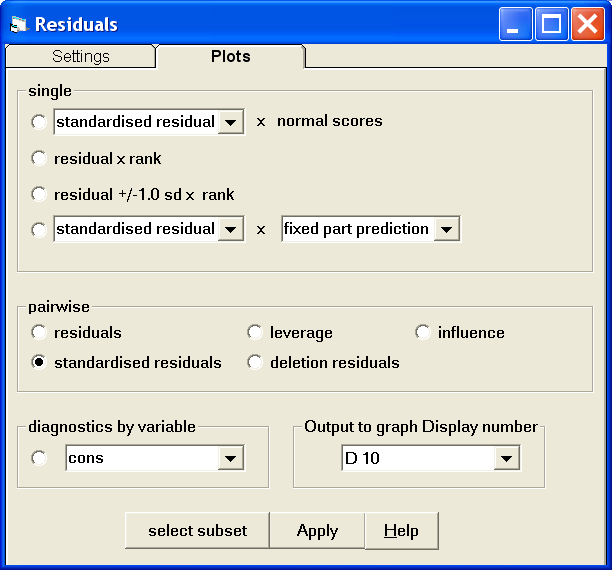
A range of plots are available from the residual plots tab.
The residuals can be standardised for probability plotting either singly or in pairs; their standard errors can be computed and plots with uncertainty intervals using these displayed; further diagnostics such as leverage values, influence values and deletion residuals are also available are also available in single or pairwise plots.
Here is an example of a plot for a pair of standardised level 2 residuals from a repeated measures data set:
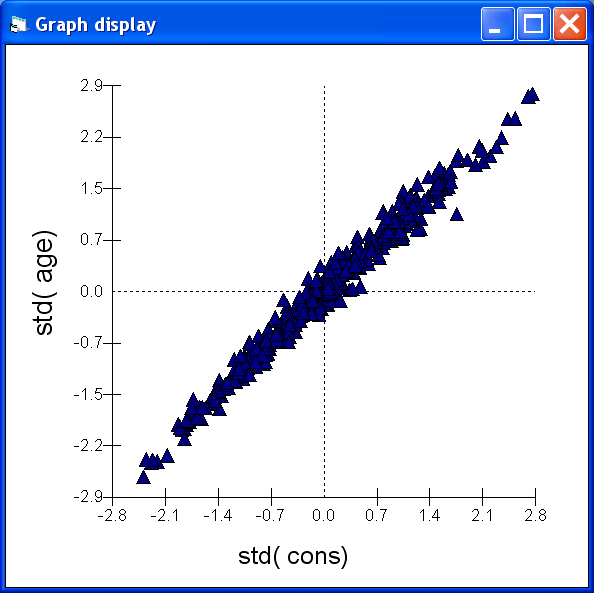
The x-axis refers to intercept residuals and the y-axis to slope residuals. Here are Normal probability plots for the intercept and slope residuals
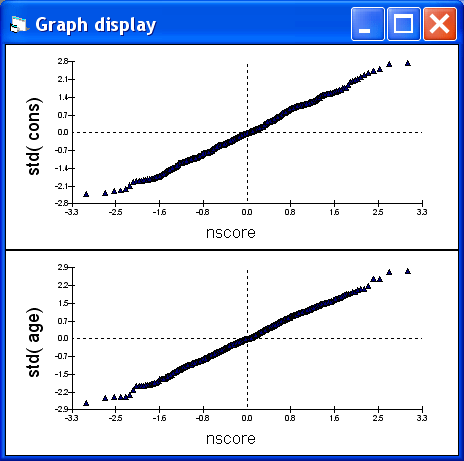
and more detailed diagnostics information for the intercept residuals
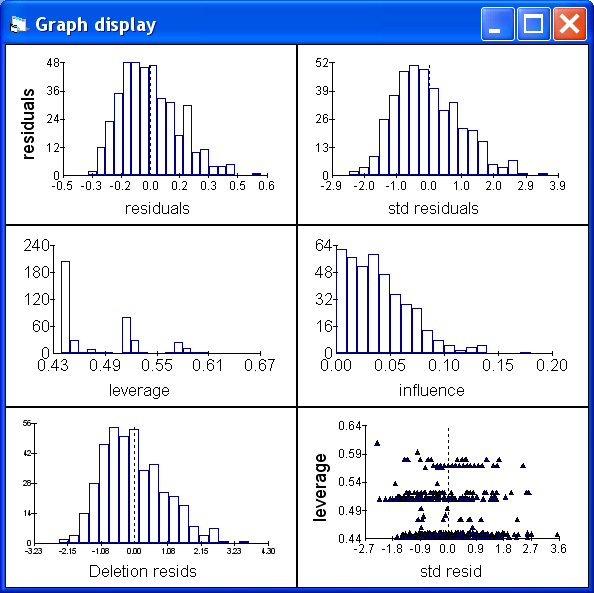
Points or lines corresponding to the same data item can be linked via highlighting:
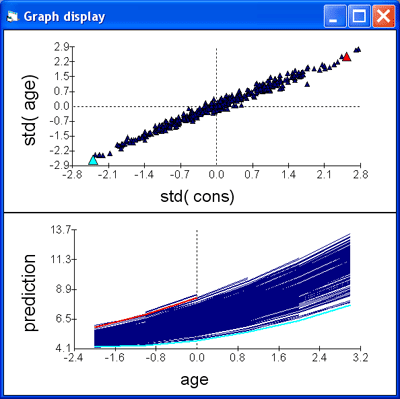
Clicking on a point in the top graph which corresponds to an intercept and slope residual pair for a given individual automatically highlights that individual in any other graphical display eg the predicted growth trajectories in the bottom graph.
Likewise selecting a growth trajectory in the bottom graph will automatically highlight the point in the top graph corresponding to that individual.
