We need better data to address regional race disparity

The Black Lives Matter movement and the global coronavirus pandemic has put ethnic inequalities in health, socioeconomic position and experiences with policing and other state institutions at the top of the political agenda. Understanding what these differences are and how to develop policies to effectively address them require evidence at both a national and regional level.
In the UK, information on the nature of ethnic inequalities improved significantly with the establishment of the Race Disparity Audit (RDA) by Theresa May’s Cabinet Office in 2017. This initiative began with a review which required all Government Departments to identify what information they held on UK public services that could be analysed by ethnicity. The amount of data unearthed was vast and varied in both quality and depth. It included Census data, official statistics, Government surveys and Departments’ own administrative records. Since then, the Cabinet Office has been working to make this information available to the public, via the online database known as ‘Ethnicity Facts and Figures’. A further strength of the RDA is the new insight it offers into inequalities at the regional level. To date, these regional data have not been given the same attention as those at the national level.
Using South West England as a case study, our investigation examines the nature of RDA data on ethnic inequalities in health, socioeconomic position, housing, education and inclusion. We look at race disparities in the region, and compare them with race disparities identified nationally and in other regions in England. We also consider the quality of the data available.
We found striking differences in the experiences of those with different ethnicities living in the South West. Many – although not all – of these appear favourable compared with national figures and those from other regions. However, there are several issues which undermine the value of RDA data as a basis for regional policy development. Small numbers of indicators are available at the regional level. There are also problems with the nature of the data provided which further limited their value.
Statutory authorities need to ensure that regional data is more comprehensive and consistent – within and between region and nationally.
There is a need to disaggregate the ethnicity categories used by many social institutions with immediate effect. It is impossible to establish the nature of existing race disparities using measures which only distinguish between groups which are ‘white’ and ‘nonwhite’. To address the problems of race disparity, we must first be able to effectively document them.
This research focused specifically on RDA data on ethnic inequalities in health, education, employment, housing and inclusion in the South West region. Note that all data were collected prior to the coronavirus pandemic and cannot reflect changes during this period. These are likely to have increased these race disparities, both nationally and regionally.
Race disparities in the South West
The South West is one of the regions with the smallest percentage of ‘other than white’ ethnic group, with 92% of the population classified as white British, 2% as ‘Asian’ (including Chinese people), 1% Black, 1.5% ‘Mixed’, 3.5% ‘white other’ and 0.3% in ‘other’ ethnic groups.
Health
RDA data available at the national level presents ethnic inequalities in a range of measures of physical and mental health and wellbeing, the experiences of patients and lifestyle factors such as diet, exercise, smoking, alcohol and drug use. However, only information on rates of physical activity are provided at a regional level. In the South West, there were higher rates of physical activity among those with ‘Mixed’ (79%), ‘Black’ (70%), ‘white British’ (67%) and ‘white other’ (69%) ethnicities but considerably lower rates among those with ‘Asian’ (48%) and ‘other’ (52%) ethnicities. Ethnic inequalities in physical activity in the South West are comparable to those of other areas, although the rates for the Asian group were the lowest of any region in England.
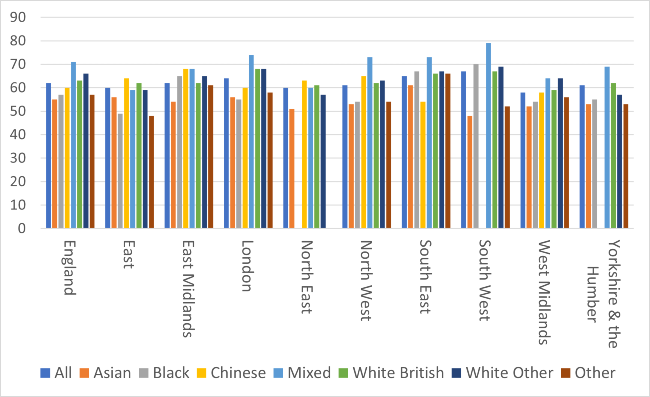
Figure 1: Percentage of people aged over 16 years classified as ‘physically active’, by region and ethnicity
Employment
RDA figures suggest positive employment and unemployment rates, both in the region in general and for specific ethnic (minority) groups in the South West compared with other regions. However, ethnic inequalities in employment persist and disadvantage ‘non-white’ ethnic groups relative to ‘white’ ones. The highest employment rates in the South West were among those in the ‘white other’ group (86%), followed by those in the ‘white British’ (79%), ‘white’ (79%), ‘Indian’(76%), ‘Mixed’ (71%), ‘Black’ (72%), ‘Asian other’ (67%), ‘Asian’ (71%) and ‘other’ (60%) groups. There were too few people in the ‘Bangladeshi and Pakistani’ group in the South West to be presented.
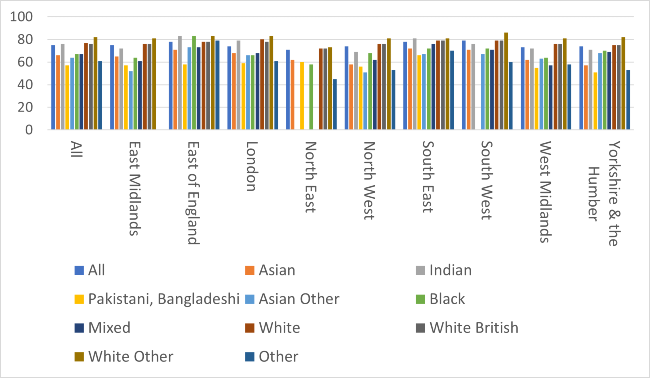
Figure 2: Percentage of 16 to 64-year olds who were employed, by region and ethnicity
According to figures on the RDA, ‘non-white’ (1.1%) people living in the South West are more likely to be claiming Job Seekers’ Allowance (JSA) than those with ‘white’ ethnicities (0.7%). This was lower than the average for England and Wales of 1.6% and 1% respectively. Black and white British people are more likely to have been claiming JSA for more than 104 weeks, in the South West and several other regions. However, rates of long-term JSA claims among those in the ‘Black’ group (20.4%) living in the South West are higher than all other regions with the exception of London and the West Midlands.
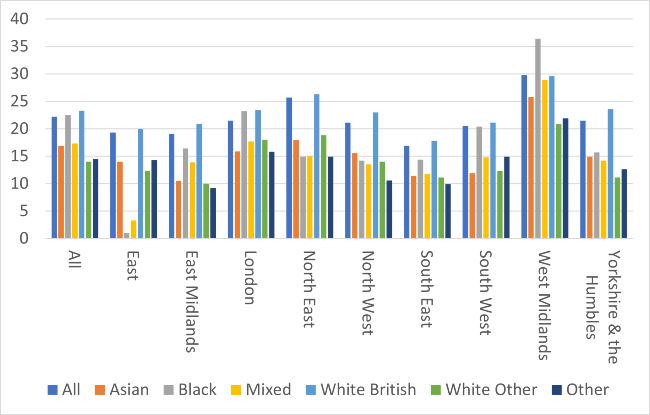
Figure 3: Percentage of claims for Jobseeker’s Allowance lasting for more than 104 weeks, by region and ethnicity
Housing
There are variations in the levels of home ownership between those in ‘white’ and ‘non-white’ ethnic groups in every region. However, at 70% and 40%, these variations are larger in the South West than elsewhere. Those living in the South West who are not in the ‘white British’ groups are three times as likely to rent than ‘white British’ people (48% vs 16%), again, a larger disparity than any other region. RDA figures suggest that in the South West there is no ethnic difference in the proportion of people in rented social housing, with 13% of the ‘white’ and 12% of the ‘non-white’ group renting their housing from a local authority or housing association.
While most (56%) of homeless households in the City of Bristol are ‘white’, almost a quarter (24%) are households in the ‘Black’ group, with 6% or fewer with other ethnicities. The lack of information on the RDA, or via other sources, regarding the ethnic profile of local authorities prevents better understanding of the extent to which this reflects the actual population in Bristol, or not. The proportion of ethnic minority homeless households in areas other than Bristol City is very small.
In the South West, ‘other than white’ households are four times more likely to live in overcrowded accommodation than white households (8% vs 2%). While ‘white British’ households are less likely to be overcrowded than those with other ethnicities in every region in England, rates of overcrowding among non-white British households, and disparities between white British and non-white British households, are larger in the South West than those in several other regions.
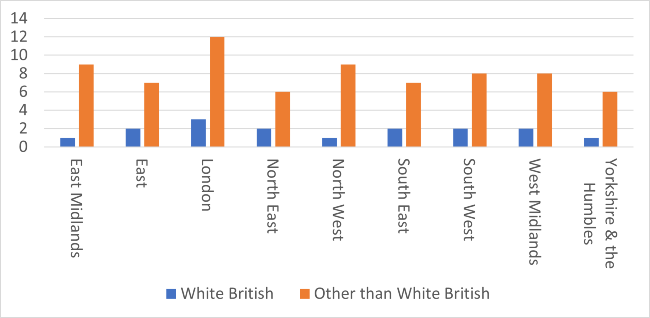
Figure 4: Percentage of households that were overcrowded by region and ethnicity
Education
Indicators of ethnic inequalities in educational attainment at preschool ages and until (but not after) the age of 16, as well as indicators concerning absences and exclusions are presented by local authority. These data do not enable comparison across regions. In the South West, these comparisons are also limited by the small number of people with ethnic minority backgrounds in some local authorities. These data are therefore an insufficient basis from which to draw strong conclusions about the presence of ethnic disparity in the region. However, there is evidence of variation in the ethnic patterning of strong GSCE passes in English and mathematics by local authority, although the more positive results of Chinese and Asian students shows more consistency both in the South West and elsewhere. There are also fewer exclusions among these groups.
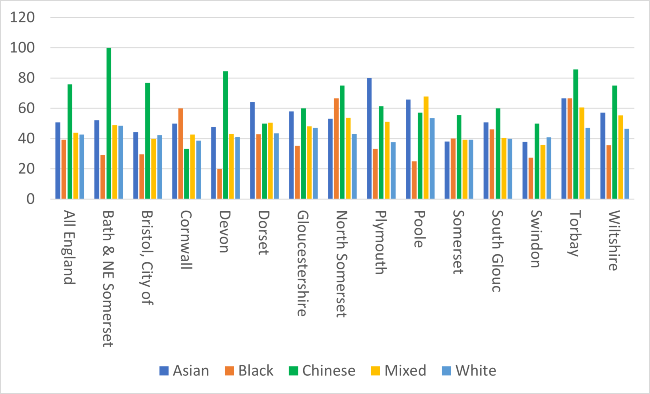
Figure 5: Percentage of GCSE pupils getting a strong pass in English and maths by local authority and ethnicity
Opportunities for improvement
There are a number of problems with the data presented on the RDA which limit their value for understanding ethnic inequalities in education, employment, health, housing and inclusion in the region.
• Fewer indicators are available at regional level. For example, regional data on inclusion is limited to internet use and health is limited to physical exercise.
• There are problems with the ethnic classifications used for many of the indicators. While partly driven by small sample sizes, this also relates to decisions made during data collection and misunderstandings about what ethnicity is and how it affects people’s lives. Often data are only available in ‘white’ or ‘other than white’ categories. Yet, it is clear, including from data presented on the RDA, that race disparity varies between groups included in the ‘non-white’ (and also the ‘white’) classification. The failure to provide more detailed information on ethnicity significantly impairs our capacity to draw useful inferences about what is driving any inequality and therefore how to address it. Even where the data presents more granularity – for example into ‘white’, ‘Black’, ‘Asian’, ‘Mixed’ and ‘other’ groups – these groups remain large and can disguise a wide range of experience among individuals in the same group.
• Some measures are categorised by region and others are by local authority, such as those for educational outcomes. This limits opportunities for comparison with other indicators and also other regions. Local data on housing uses either region or local authority, which limits the development of a detailed picture of this experience by either measure.
• The capacity to interpret some findings – e.g. regarding levels of homelessness by local authority – is limited by a lack of information regarding the ethnic profile of local authorities in the region.
• There are also problems with the level of analysis to which these regional data are exposed. Ethnic inequalities in health and other experiences are significantly affected by differences in age, socioeconomic position etc between the groups. Analyses exploring the impact of variations in age, gender or socioeconomic position on ethnic inequalities at the national level are therefore valuable. But, regional evidence is not similarly interrogated.
Policy implications
There are striking differences in the experiences of those with different ethnicities living in the South West. This adds to the already considerable evidence regarding the persistence and drivers of ethnic inequalities in the UK. There is a clear need for both national and local government to commit to addressing the causes of these inequalities.
At present, though, the data available via the RDA remains somewhat incomplete. We need more comprehensive, and more detailed, data if we are to ensure that any action taken is effective. To achieve this:
• National, regional and local statutory authorities must respond to the requirements of the Equalities Act 2010 to collect detailed evidence on the presence of ethnic inequalities in a comprehensive range of indicators, using methods which meet current guidance for best practice. • The Government must take responsibility for ensuring that these requirements are met.
• The Government Statistical Office and the Cabinet Office must ensure greater consistency in the the collection of data for the Race Disparity Audit across sector, to enable comparability across sector and region. This includes consistent use of indicators of regional or local authority.
• The Government Statistical Office and the Cabinet Office must also provide guidance on best practice approaches to collecting information on ethnicity, including where numbers of people in particular groups is low.
• The Cabinet Office must invest the same effort in the analysis and presentation of data available at the regional level as it does those available nationally to ensure regional variations – in inequalities and data quality - are identified and addressed.
Authors
Saffron Karlsen (University of Bristol), Angelique Retief (University of Bristol / Black South West Network), Sado Jirde (Black South West Network)
Policy Report 62: Oct 2020
We need better data to address regional race disparity (PDF, 1,773kB)
Contact the researchers

Further information
Black South West Network (BSWN) and University of Bristol are working together to identify and address gaps in the evidence regarding the drivers of race disparities in the South West and enable the development of effective responses to them. It is only through evidence-based understanding of the systemic impact of racial and socioeconomic structural inequalities on the lives of Black communities, and community-led solutions which respond to them, can we achieve a more equitable society.
BSWN’s over-arching strategic intent is to build dynamic, independent, and strong Black communities, businesses and organisations that are empowered to flourish while challenging systemic barriers and forging a true path for themselves.