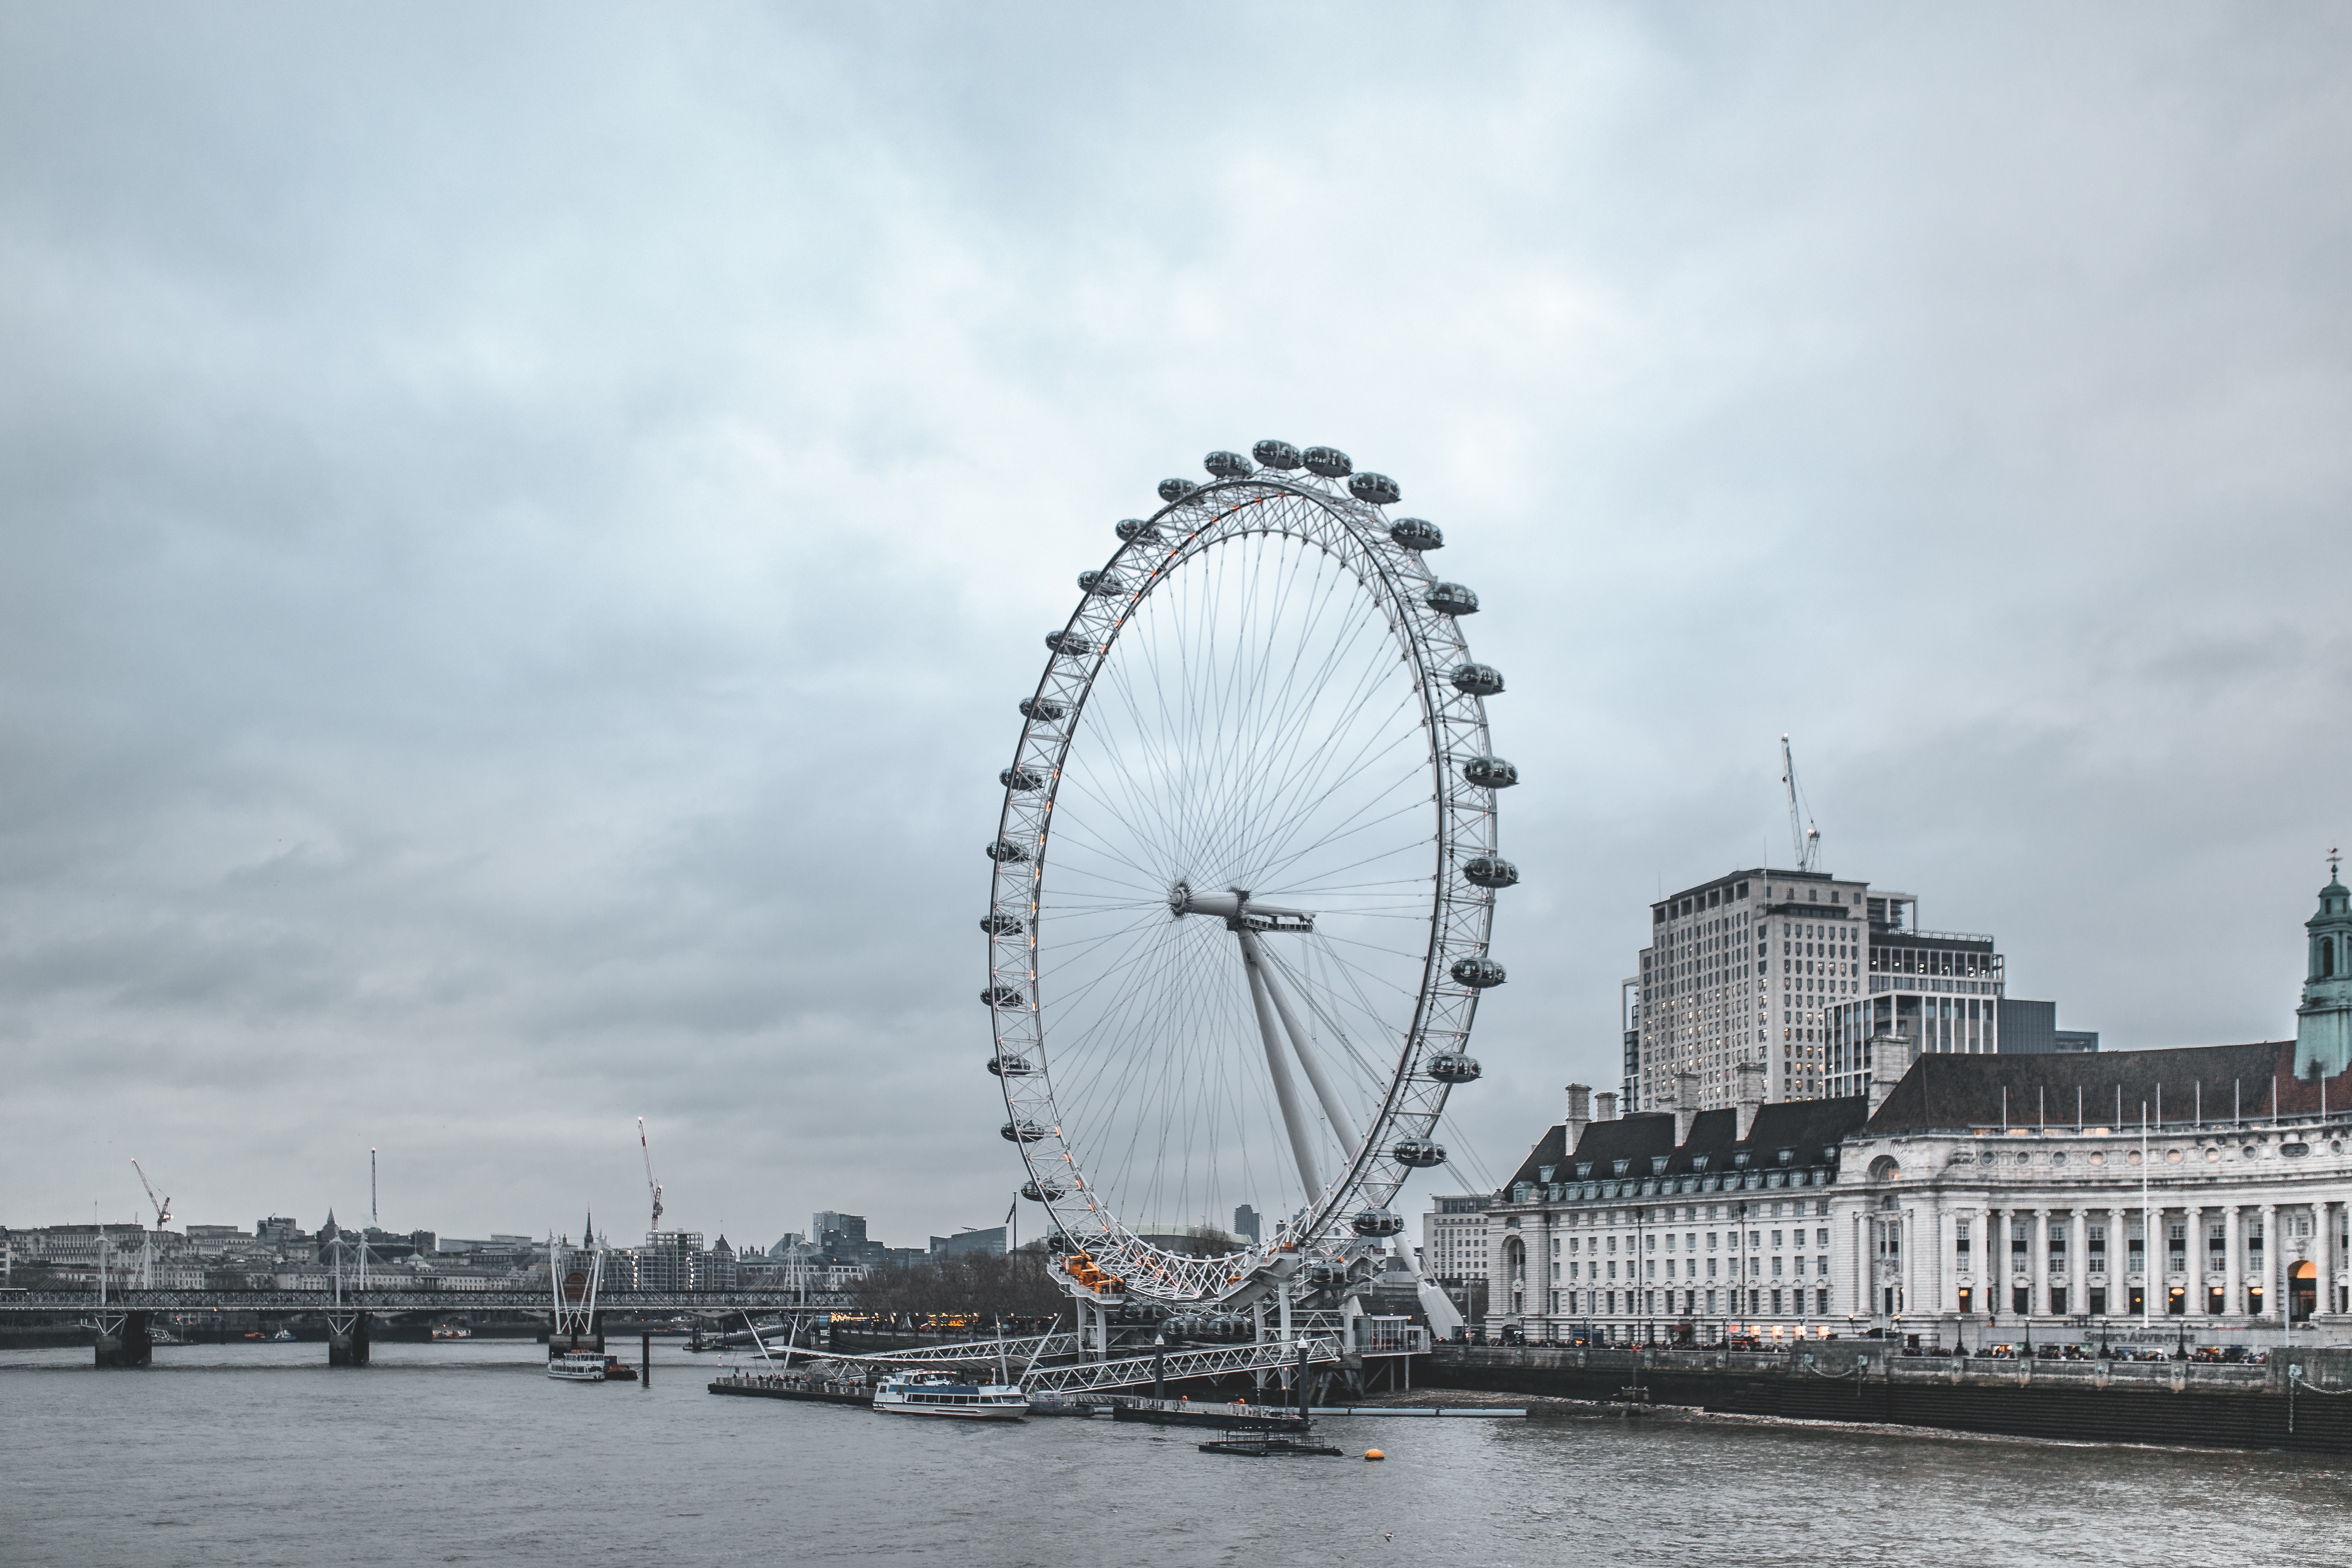
Evaluating risk level in cities to support tourists and inhabitants during COVID
Emergencies have a huge impact on the choice of tourism destination and the life of inhabitants in these areas. People are afraid to travel to those areas and either defer travel or change their destination. The World Tourism Organization estimated the economic loss for tourism due to COVID-19 is more than 2 trillion US dollars in global GDP (UNWTO, 2021).
However, even during emergencies, a whole tourism area is not necessarily dangerous. Instead, the risk might change while moving around the area. Accordingly, our research provides a tool to develop safe tourist paths to support tourism and limit economic loss without compromising people’s safety. We developed a new model to provide detailed maps where the different areas of a city and the main tourist attractions are plotted together with the probability of being exposed to COVID-19 contagion. We specifically show how to calculate the contagion risk at the borough/area level against the actual models considering the whole city. Specifically, the mathematical model underlying the map generation allows for computing the risk-level of contagion accounting for the complexity of healthy and infected people’s possible movements around the city. Yet, it translates this mathematical complexity into an intuitive colour-map that tourists and residents can easily visualise and use to make decisions.
Policy implications
Our findings are presented in the context of the broader literature on tourism aimed at supporting policy-makers to make tourists’ and residents’ paths safer across the city during health emergencies and to avoid tourism bans and the closure of all attractions:
• Policy-makers should use this kind of map to identify the safest routes across the lower risk areas. This will allow people to move around the city while being exposed to a lower risk of contagion thus avoiding the total closure of the whole city.
• Policy-makers could develop targeted actions devoted to those areas with higher risk levels to limit the risk of contagion for people, while encouraging alternative routes across lower risks areas.
• Policy-makers should make this kind of risk map available and accessible to help tourists and residents understand the risk of exposure to contagion in a specific area and help to better manage their fear of infection.
• Policy-makers should keep this kind of map constantly updated to reflect the continuous changes in the data on contagion.
Key findings
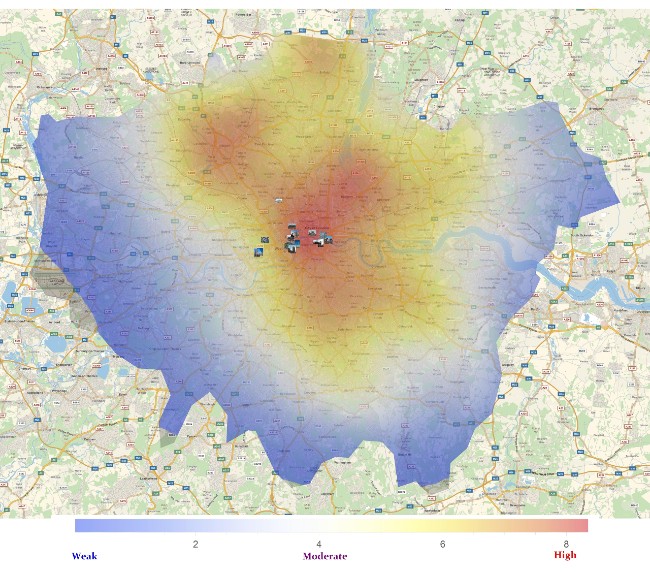
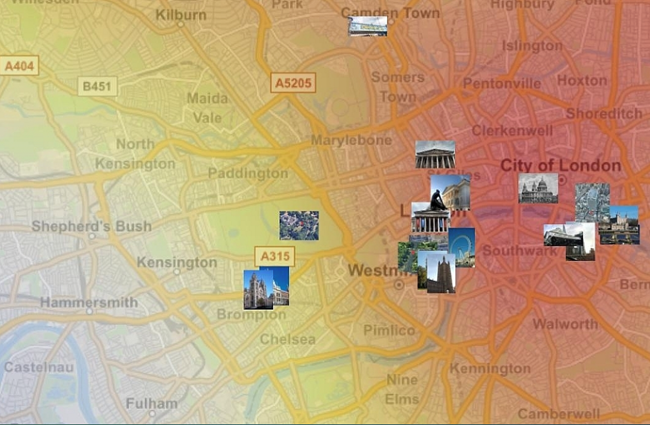
The contagion risk is not constant throughout the city but changes from place to place. Our map identifies such risk-levels, square-foot by square-foot. Our results lead to a high-resolution, extremely detailed map, where tourist attractions are mapped together with the probability of being exposed to health risks (Figure 1).
• Our map (Figure 2) shows how and where risk levels change (from low to high), and it estimates the probability of someone being infected when moving around the city in every borough or street rather than at the city level.
• Our map increases the likelihood of travel intention for prospective tourists, helping them base travel decisions on objective data.
• A panel of 200 prospective international tourists stated they would consider using this map when choosing the destination and planning visits to attractions once in the city.
• We computed the risk map for the COVID19 contagion risk in London, but it can be applied to different risks such as other diseases, terrorism, etc. and different cities.
Further information
Further information and the details about the map-generating algorithm and mathematics can be found at:
Pantano E., Scarpi, D., Vannucci V., Bilotta E., Pantano P. (in press.) Probability- density risk-maps for supporting tourism. Annals of Tourism Research. Available at: https://www.sciencedirect.com/science/article/pii/S0160738321001377
Authors
Dr. Eleonora Pantano (University of Bristol); Dr. Daniele Scarpi (University of Bologna); Dr. Virginia Vannucci (University of Verona); Prof. Eleonora Bilotta (University of Calabria); Prof. Pietro Pantano (University of Calabria)
Policy Briefing 102: June 2021
Evaluating risk level in cities to support tourists and inhabitants during COVID (PDF, 691kB)
Contact the researchers
Dr. Daniele Scarpi
Prof. Pietro Pantano