Bristol in Brief: Atmospheric measurements improve global emissions reporting
In 2019, new emissions of the internationally banned ozone depleting substance, CFC-11, were identified using data from atmospheric measurement stations in Asia. The emissions were in clear breach of international commitments to limit the use of gases that are harmful to the atmosphere. High profile cases like this demonstrate the importance of atmospheric measurements and modelling, to understand whether commitments are being met. There is an urgent need to expand the use of these measurement and modelling verification techniques, as an important tool to aid international efforts against ozone depletion and climate change.
Background
There are many substances produced by human activity that have high potential to damage the health of our planet. Left uncontrolled, emissions of these gases could damage the environment and harm people and our societies; we have already caused measurable damage to the climate [1] and the ozone layer [2].
Greenhouse gases (GHGs) prevent heat escaping from the planet. Human activity is responsible for rapidly increasing levels of GHGs, such as CO2, which are causing the planet to heat up [1]. This climate change will lead to rising sea levels, more extreme weather, water scarcity and other impacts [3].
Ozone Depleting Substances (ODSs) react with ozone in the upper atmosphere and deplete the ozone layer. Human activity has already resulted in a depleted ozone layer, allowing more ultraviolet radiation to reach the surface. Increased ultraviolet radiation is harmful to living organisms and can cause mpacts such as skin cancer and cataracts in humans, and crop damage [4].
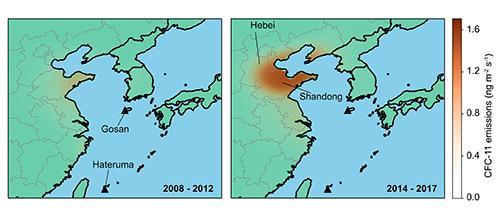
Emissions inferred from atmospheric observations at Gosan and Hateruma monitoring stations show an increase from eastern China between the periods 2008–2012 (left) and 2014–2017 (right).
The production of ODSs and emissions of GHGs are subject to United Nations policy frameworks (see Current Policy Frameworks section below). To increase trust, transparency and accountability in the process, emissions are reported to international organisations in the form of annual inventories which detail total emissions of each gas. Inventories are calculated by national governments using ‘bottom-up’ (accounting) methods, and it is considered best practice to verify emissions using ‘top-down’ (atmospheric data based) methods [5] (see Box 1). Top-down methods have seen limited use in official inventories so far and are mostly reported by independent researchers in the scientific literature.
Researchers using top-down methods have provided important evidence on discrepancies between reported and actual emissions for international policy (see Case Studies).
Policy implications
- Transparent monitoring systems can improve the accuracy of reported emissions and increase trust between parties.
- Unaccounted emissions of banned substances undermine international policy. Atmospheric measurements and modelling have been used to identify sources of unreported emissions, highlighting the need for active monitoring.
- As the technology improves and emission reduction commitments increase, emissions monitoring is becoming increasingly important at all scales, from urban to global.
Box 1: Bottom-up and top-down methods
Bottom-up methods combine information on individual actions with statistics on nation-wide frequency. An example for a single source would be multiplying the emissions per mile for an average car by the total number of miles driven in cars in the UK for a given year. A national inventory is compiled by performing this calculation for every emission source required under international policy.
Top-down methods combine measurements of the atmosphere and models that simulate how gases travel through the atmosphere. Statistical models calculate the emissions required to reproduce the measurements and can be used in the evaluation process of national inventories.
Bottom-up methods give detailed breakdowns of emissions from different activities but can have large uncertainty based on assumptions needed. Top-down methods generally focus on total emissions inferred from atmospheric observations, but are subjects to
uncertainties in computer models of atmospheric dispersion.
Why are atmospheric measurements important?
Inferring gas emissions through a through a top-down evaluation process increases the accuracy and trust in reported emission levels. As emission reduction commitments become stronger with shorter timescales, stronger evidence for policy success will be required.
Top-down methods do not replace bottom-up inventories for reporting emissions but are complementary. Bottomup inventories can inform the models used to calculate top-down results and the results of top-down methods can highlight oversights or miscalculations in inventories.
The components of a top-down monitoring system (see Box 2) are complex and require well equipped scientific teams to operate. Direct communication between topdown, bottom-up and policy teams enables monitoring results to be used most effectively.
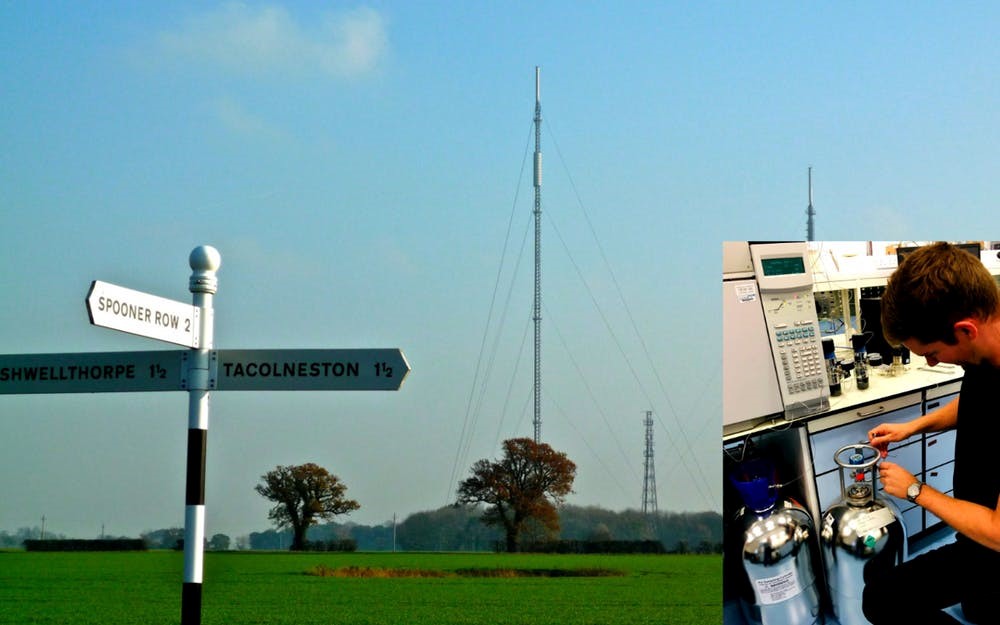
Top-down methods are used as part of national GHG reporting for the UK, Switzerland and Australia. National measurements for other countries are also reported by independent teams in the scientific literature. There are various examples of measurement networks around the world including systems in the UK [6], Switzerland [7], Europe [8], and global networks [9], as well as atmospheric observation satellites (eg. GOSAT and TROPOMI).
Measurement networks can be set up to monitor both GHGs and ODSs, although multiple instruments are required for the full suite of regulated gases.
Box 2: Top-down evaluation systems
A top-down evaluation system relies on several major components:
- An atmospheric measurement network that can accurately measure targeted gases in a defined region
- An inverse model, which models atmospheric dynamics and relates atmospheric measurements to emission quantities and locations
- A team of experts to maintain the system and correctly interpret results
Current policy frameworks
There are two major international policy frameworks that focus on GHGs and ODSs. The first is the United Nations Framework Convention on Climate Change [10] (UNFCCC), which includes the 2015 Paris Agreement [1], and sets out international policy on reducing GHG emissions to prevent (mitigate) climate change.
The Paris Agreement seeks to limit global warming to well below 2°C and to aim for below 1.5°C. In line with the Paris Agreement, nations, cities and individual organisations are setting ambitious targets, such as the aim of net-zero emissions by 2030 by the city of Bristol or the country of Norway, or by 2050 for London and the UK.
The UNFCCC’s Kyoto Protocol [11] requires Annex I (developed) countries to submit a National Inventory Report (NIR) each year. NIRs contain a detailed report of emissions, categorised by emission source and gas (see Box 3), as well as measures being taken to reduce emissions. Other countries submit less frequent and detailed National Communications to report on emissions. The Intergovernmental Panel on Climate Change (IPCC) provides uniform guidelines for producing inventories. Of the 43 Annex 1 parties, only the UK, Switzerland and Australia include top-down verification, which increases accuracy, trust and transparency.
The Montreal Protocol [2] is the policy framework that relates to ODSs. It is the only United Nations treaty to be ratified by all 197 member states and is widely regarded as one of the most successful treaties of all time. [12] Since being adopted in 1987, over 100 substances are now regulated by the treaty (see Box 3), with developing countries given more time and funding to stop production of controlled chemicals. The Montreal Protocol limits production of ODSs, but previously produced ODSs will remain present in older buildings and appliances that will continue to slowly leak.
In 2016 the Kigali Amendment was agreed, and extended the Montreal Protocol to include HFCs, which are powerful greenhouse gases. Prior to the Amendment, the uncontrolled usage of HFCs was predicted to cause substantial global warming, and so the Kigali Amendment was added to cover this category of substances.
Box 3: Regulated substances
For the Montreal Protocol three generations of gases, used primarily as refrigerants or
propellants, are controlled:
1. Chlorofluorocarbons (CFCs), the most harmful ODSs which are largely responsible for the hole in the ozone layer. Production for emissive uses is banned
2. Hydrochlorofluorocarbons (HCFCs), intended as a temporary replacement to CFCs as they are less harmful, are being phased out
3. Hydrofluorocarbons (HFCs) are not ODSs but are powerful GHGs. The Kigali Amendment limits production
The Kyoto Protocol required the reporting of emissions of the major greenhouse gases: Carbon dioxide (CO2), Methane (CH4), Nitrous oxide (N2O), Hydrofluorocarbons (HFCs), Perfluorocarbons (PFCs), and Sulphur hexafluoride (SF6).
The University of Bristol’s Atmospheric Chemistry Research Group (ACRG) are world leaders in emissions monitoring. ACRG operate high precision measurement sites as part of the UK’s network (the Deriving Emissions linked to Climate Change, or DECC network). ACRG are also part of a global emissions monitoring network (Advanced Global Atmospheric Gases Experiment, or AGAGE). The ACRG team is developing novel models to improve top-down methods calculating emissions levels. Research performed by the ACRG is often used as evidence in policy discussions, and several case studies of this research are shown below.
National GHG inventory verification
As noted above, countries under the Kyoto Protocol must submit a National Inventory Report of their emissions. Unlike most countries, the UK’s National Inventory Report [13] submitted to the UNFCCC includes the results of topdown modelling. This work is a collaboration between Bristol’s ACRG and the Met Office through the UK DECC network. Ricardo (a global engineering and environmental consultancy) and other industry groups, who compile the UK inventory, use the results of the topdown methods to improve the bottom-up reports. The reported emissions of the potent GHG HFC-134a [14], which is used in mobile air conditioning, is an example of this. The top-down results showed emissions half as high as reported in the inventory. The cause of this discrepancy was linked to assumptions used in the bottom-up methods which did not agree well with real world usage of the gas.
India is thought to be the second largest emitter of methane, which is the second biggest contributor to global warming. India’s National Communication to the UNFCCC gives much lower methane emissions than a widely used independent global inventory, the Emissions Database for Global Atmospheric Research (EDGAR). By performing the first high-resolution inverse modelling study to combine satellite, aircraft and surface measurements across India, research by the ACRG and the University of Bristol School of Geographical Sciences found emissions over the period 2010 to 2015 to be consistent with India’s official inventory [15]. This
research demonstrates that top-down methods can improve confidence in national reports, an important component of international policy.
Identifying unreported production
In 2018 researchers, including the ACRG, reported signs of increasing global emissions of the banned ODS CFC-11, but it was not clear where these emissions originated [16].
Subsequently, ACRG led an international team using regional top-down methods, who were able to locate the source of the emissions [17]. By using several independent models with data from the AGAGE network and Japanese National Institute for Environmental Studies, researchers were able to pin the emissions to eastern mainland China with high confidence. The topdown methods showed a 110% increase in emissions from the region between the years 2014-2017 compared to 2008-2012.
As a result of this research, China released statements saying that it had seized and destroyed samples of CFC-11 produced by ‘rogue manufacturers’ [18] and that the government planned to set up a national measurement network to monitor for further emissions [19].
Holding parties accountable
The potent GHG, HFC-23, is due to be phased out under the Kigali Amendment to the Montreal Protocol. China and India produce the majority of HFC-23 (accounting for 75% of 2017’s global production) and both reported ambitious emissions abatement programmes starting in 2015, although not yet having ratified the Kigali Amendment. With these programs in place, global emissions were expected to decrease by 87% between 2014 and 2017. Instead, AGAGE observations demonstrated an increase in emissions.
Research led by ACRG produced bottom-up and topdown methods to compare the observed and expected emissions of HFC-23 [20]. Based on the large mismatch of the resulting emission levels, and consideration of other possibilities, the research concludes that it is likely that China’s reduction plan has been unsuccessful.
Current considerations
The 2019 update to the IPCC guidelines recommends that top-down methods are used for verification. As one of only three countries using top-down methods for UNFCCC reporting, the UK should push for wider adoption of this practice by other parties, showcasing innovation in the UK. The main barriers to additional networks across the world are likely to be a lack of trained personnel and financing.
City scale emissions monitoring is becoming increasingly important and is being used in cities such as Paris, Los Angeles, Cape Town, and Rotterdam. The London GHG project is establishing a network in the UK capital, which will provide evidence to help with the net-zero by 2050 commitment [21]. Monitoring could be further expanded across the UK to help local commitments.
Researchers are currently looking into more detailed, topdown analysis methods which would allow scientists to identify source sectors of emissions, such as fossil fuel burning or natural gas leakages. The ACRG-led Detection and Attribution of Regional greenhouse gas Emissions in the UK (DARE-UK) project [22] is working to improve UK capabilities in this area. Funding projects such as DARE-UK are vital to further improving GHG inventories.
Endnotes
1. Masson-Delmotte, V., P. Zhai, H.-O. Pörtner, D.Roberts, J. Skea, P.R. Shukla, A. Pirani, W. Moufouma-Okia, C. Péan, R. Pidcock, S. Connors, J.B.R. Matthews,
Y. Chen, X. Zhou, M.I. Gomis, E. Lonnoy, T. Maycock, M.Tignor, and T. Waterfield (eds.), Global Warming of 1.5°C. An IPCC Special Report on the impacts of global
warming of 1.5°C above pre-industrial levels and related global greenhouse gas emission pathways, in the context of strengthening the global response to the threat of climate change, sustainable development, and efforts to eradicate poverty. World Meteorological Organization, Geneva, Switzerland, 2018.
2. United Nations. About the Montreal Protocol. Available from: https://www.unenvironment.org/ozonaction/who-we-are/about-montreal-protocol.
3. The Parliamentary Office of Science and Technology. Limiting Global Warming to 1.5°C. Available from: https://post.parliament.uk/research-briefings/post-pn-0594/.
4. World Health Organization. Stratospheric ozone depletion, ultraviolet radiation and health. Available from: https://www.who.int/globalchange/summary/en/index7.html.
5. IPCC, 2019 Refinement to the 2006 IPCC Guidelines for National Greenhouse Gas Inventories. 2019.
6. Atmospheric Chemistry Research Group. UK Deriving Emissions linked to Climate Change, (DECC) network. Available from: Available from: http://www.bris.ac.uk/chemistry/research/acrg/current/decc.html.
7. The swiss CarboCount-CH Project Site. Available from: http://www.carbocount.ch/.
8. The European Integrated Carbon Obseration Sysytem (ICOS) Project Site. Available from: https://www.icos-ri.eu/.
9. The Advanced Global Atmospheric Gases Experiment network (AGAGE) Project Site. Available from: https://agage.mit.edu/.
10.UNFCCC. United Nations Climate Change. Available from: https://unfccc.int/.
11. UNFCCC. Kyoto Protocol Available from: https://unfccc.int/kyoto_protocol
12. The Montreal Protocol: triumph by treaty. 2017 UN environment programme
Available from:https://www.unenvironment.org/news-andstories/
story/montreal-protocol-triumph-treaty
13. United Kingdom of Great Britain and Northern Ireland. 2019 National Inventory Report. Available from: https://unfccc.int/documents/194909
14. Say, D., et al., Re-Evaluation of the UK's HFC-134a Emissions Inventory Based on Atmospheric Observations. Environ Sci Technol, 2016. 50(20): p.11129-11136.
15. Ganesan, A.L., et al., Atmospheric observations show accurate reporting and little growth in India's methane emissions. Nat Commun, 2017. 8(1): p. 836.
16. Montzka,S.A., et al., An unexpected and persistent increase in global emissions of ozone-depleting CFC-11. Nature, 2018. 557(7705): p. 413-417
17. Rigby,M., et al., Increase in CFC-11 emissions from eastern China based on atmospheric observations. Nature, 2019. 569(7757): p. 546-550.
18. McGrath, M. Ozone layer: Banned CFCs traced to China say scientists. Available from: https://www.bbc.co.uk/news/scienceenvironment-48353341
19. Cyranoski,D. China feels the heat over rogue CFC emissions. Available from: https://www.nature.com/articles/d41586-019-02109-2
20. Stanley,K.M., et al., Increase in global emissions of HFC-23 despite near-total expected reductions. Nat Commun, 2020. 11(1): p. 397.
21. Greater London Authority, Zero carbon london: A 1.5c compatible plan. 2018.
22. DARE-UK. Project Site. Available from: https://dareuk.blogs.bristol.ac.uk/
Bristol in Brief 2: July 2020
Atmospheric measurements improve global emissions reporting (PDF, 555kB)
Tilly Hoare, Matt Rigby