Editing input files produced by Stat-JR
Interoperability with other packages (e.g. R, WinBUGS, Stata, etc.) in Stat-JR works by constructing input files consisting of a combination of data files and script files that are then used by the other package. These script files may create graphs and datasets and also fit statistical models.
In the new release of Stat-JR these files are created prior to execution in the other package and the user now has the option to edit the files. We will illustrate this here by making some changes to the script files for R. For another example the user can look at the documentation on starting values where we edit the initial values files for WinBUGS.
Here we will use the template Regression2 and the dataset tutorial. Clicking on Run we then set up the inputs as follows:
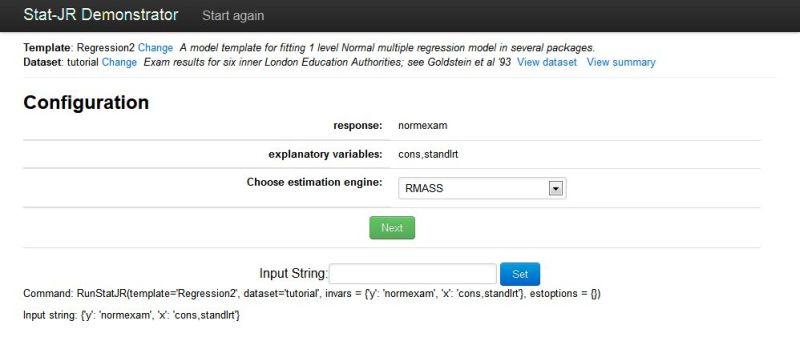
Clicking on Next will create the dataset file (datafile.dta) and the script file script.R, each of which is accessible via the drop-down list above the left pane; here we’ve chosen to look at script.R:
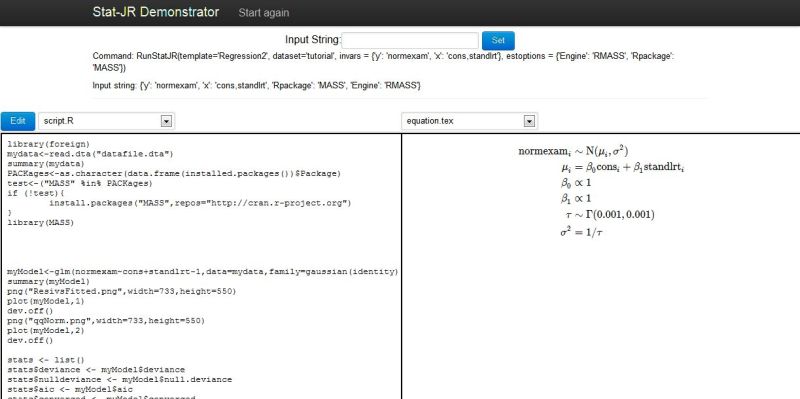
This script file begins by installing libraries required in R and reading the data into an R data frame called mydata prior to the single glm command that runs the regression. There are then some plotting commands which create the output plots that get sent back to Stat-JR. Finally the last set of commands creates datasets to send back as additional objects available to view in Stat-JR.
In theory we can make any changes we like to the R code to customise it ourselves. In practice we are constrained by what data is sent to R and by the need to ensure commands are appropriate so that objects created are sent back to R. We will therefore illustrate one simple change to send back an additional graph that plots the response against the predictor.
To do this we click on the Edit button and change the text as follows:
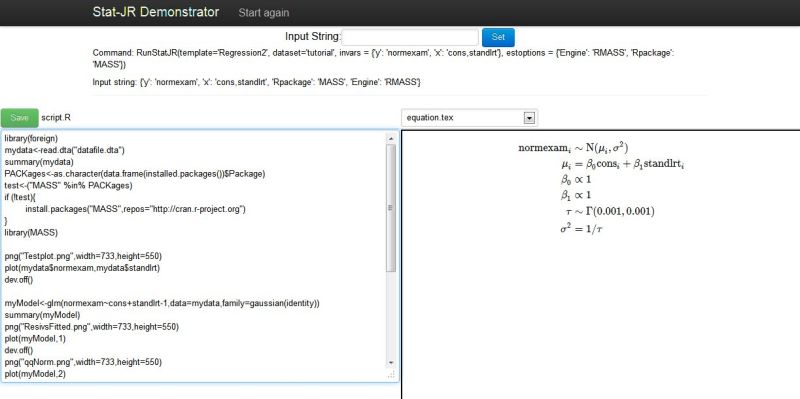
Here we have added the three lines:
png("Testplot.png",width=733,height=550)
plot(mydata$normexam,mydata$standlrt)
dev.off()
These lines firstly give the plot a filename with dimensions which are the same as the other existing plots. There is then a call to the generic plot function in R and finally a command that finishes the plotting. Having made these changes, if we then press the Save button and then the Run button we can then look in the right-hand list to see what outputs were created. We will see that there is indeed an output called Testplot.png and selecting it we see the following:
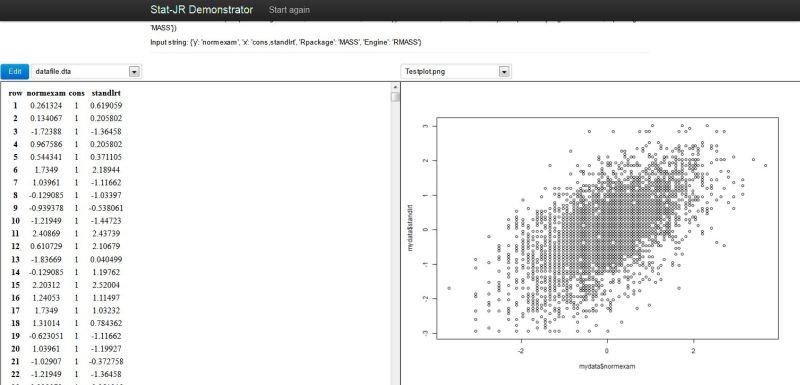
This clearly gives great flexibility as to what can be executed, via Stat-JR, within another package. We envisage that, for examples like this, the feature is used for experimentation and that any desired generic changes might then be incorporated by the user in a customised version of the package.
Back to New features.