Case Study: Methods of Characterising Social Distance
This case study - conducted as part of the ESRC grant The use of interactive electronic-books in the teaching and application of modern quantitative methods in the social sciences - was undertaken with the kind involvement of Paul Lambert.
Paul is a Professor in the Sociology, Social Policy and Criminology group in the School of Applied Social Science at the University of Stirling, UK.
Paul is a social scientist who investigates a range of substantive topics, and predominantly issues pertaining to social stratification and inequality, typically employing quantitative analysis of secondary survey datasets in doing so. In addition, Paul has as a strong ongoing interest in improving the infrastucture within which research takes place: for example, exploring the opportunities presented by online tools to facilitate better data management, documentation and opportunites for collaboration.
The case study with Paul relates to his work, with colleagues, on the ESRC-funded project Is Britain Pulling Apart? This project explored whether there were any apparent changes, across recent generations, in the extent to which people tend to associate with people much like themselves with regard to certain social categorisations. So, for example, are co-habiting couples in modern day Britain more likely to have occupations within a similar social stratum than co-habiting couples in the past?
If Britain is 'pulling apart', then one would hypothesise that couples are becoming more similar (exhibiting greater homogamy) with regard to the categories of social phenomena within which they fall: i.e. there would be increasingly less variation within such social networks, and increasingly more variation between them. The opposite would be true if Britain were, instead, 'pulling together'.
As Paul notes, there are a wide variety of methods one can employ, and data-related decisions one can make, in attempting to answer such a question. These range from the choice of which social relationships it might be important to explore (e.g. friendships (trends in the extent of homophily), couples, etc.) to the selection of which social phenomena to measure as an index of social distance (above we used the example of occupation - and of course characterising social distance between types of occupation is, in itself, a very complex endeavour - but of course one could choose to measure social distance by investigating other phenomena, such as education, qualifications or even one's favoured newspaper).
Alongside these considerations, of course, there is a question of what opportunities there might be to explore any of these phenomena. Certain government-funded surveys, for example, provide an expansive source of data which, potentially at least, could shed light on what may be very subtle trends in some of these types of relationship, such as co-habiting couples, and at least some of these indices of social stratification. Datasets such as the Labour Force Survey or the (now discontinued) General Household Survey, both of which the Is Britain Pulling Apart? project explored (and both accessible via the UK Data Service), survey(ed) the members of many thousands of households.
Whilst such resources can provide a rich source of data to the researcher, they are, of course, secondary datasets - i.e. collected by third parties without the specific aims of one's own research project in mind - and as such another layer of decision-making may be necessary, as one attempts to select cases and perhaps transform data to derive the variables needed to answer one's own research questions from survey items which may not have been designed to readily yield it. In addition to these operational definitions and data management decisions, there is, of course, the matter of how to summarise, and analyse, the data at one's disposal, and to this end a wide variety of methods have been employed in the literature, including the use of log-linear models, correspondence analysis, Cramer's V, and other methodological developments (e.g. Smith et al., 2014).
One consequence of this complexity is that the answer to a question such as "Is Britain Pulling Apart?" may be "it depends"; i.e. it depends on which relationships one looks at, how one operationalises social distance, and the choices one makes when selecting, transforming, summarising and analysing data. Such an equivocal conclusion perhaps should not be a surprise: the relationship between the constructs of interest and the myriad of factors which may influence them are likely to be highly complex and multifaceted, and furthermore the data researchers have at their disposal of course maps uncertainly on these latent phenonmena; i.e. there cannot be, of course, any such thing as a single, 'correct' path through all the decisions a researcher needs to make when answering such a research question, and thus the answer is consequently complex.
Paul predominantly used the statistical software package Stata to explore and analyse the data. The Stata scripts (.do files) he created as part of his work are long and quite complex, so we took portions of them to explore how we might replicate aspects of the functionality therein using Stat-JR, which can interoperate with Stata, and also a range of other third-party-authored software.
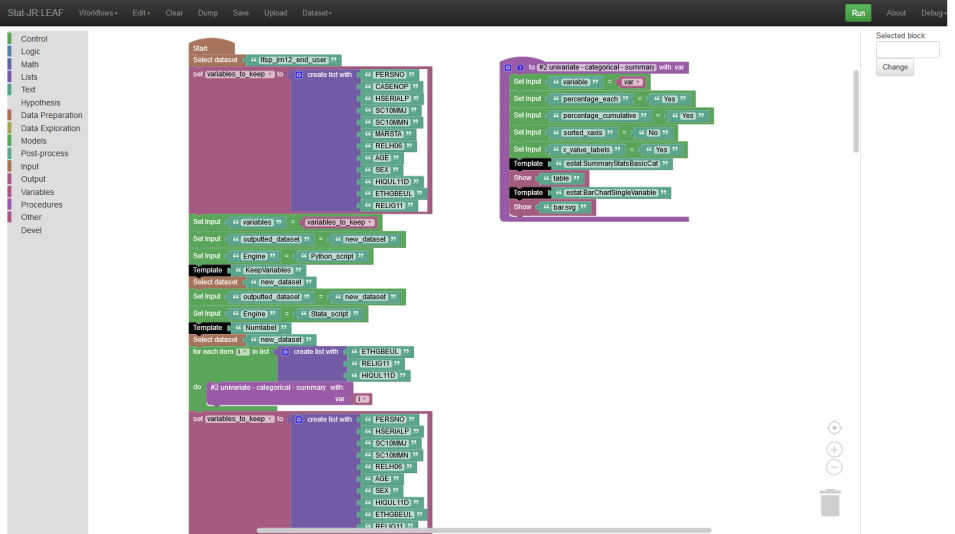
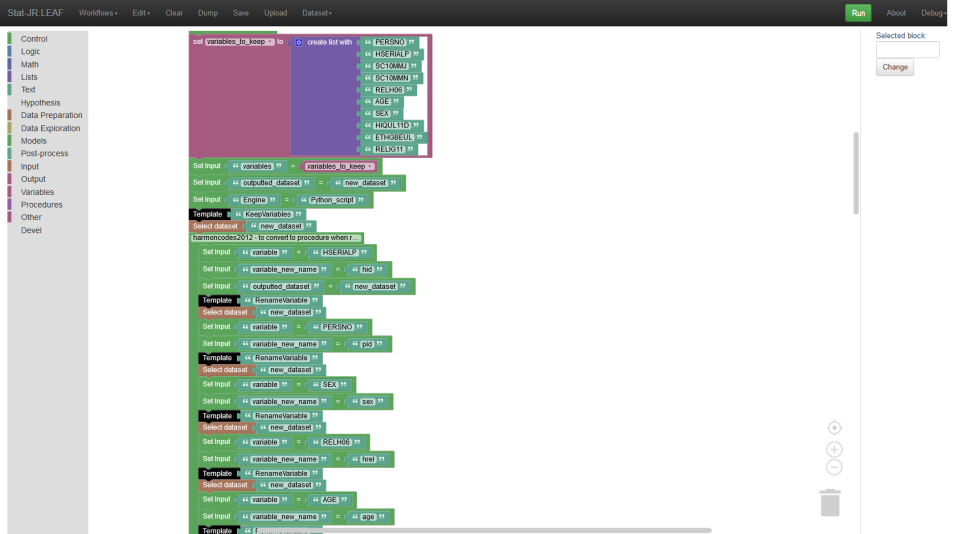
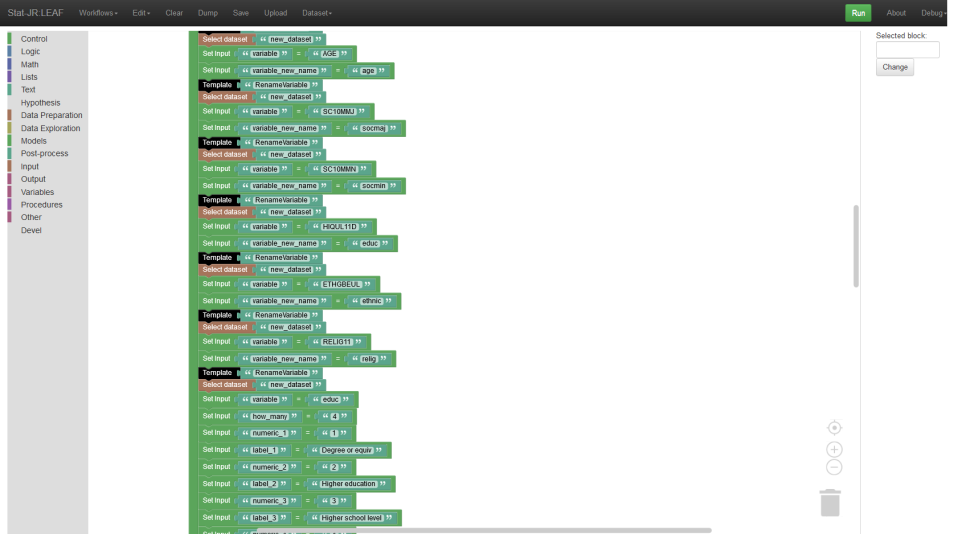
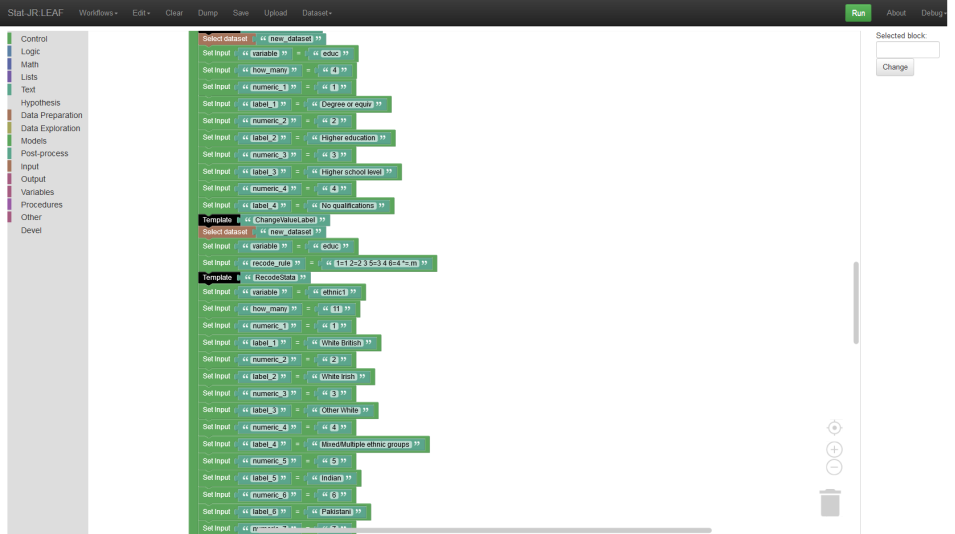
This Stat-JR workflow, with supporting templates, can be downloaded via the following link: case_study_social_distance_wf (zip, 11 kb).
Please note, to run this workflow, you will need to download the relevant Labour Force Survey dataset from the UK Data Service, having first registered and gained the necessary permissions to do so, as per their terms and conditions.
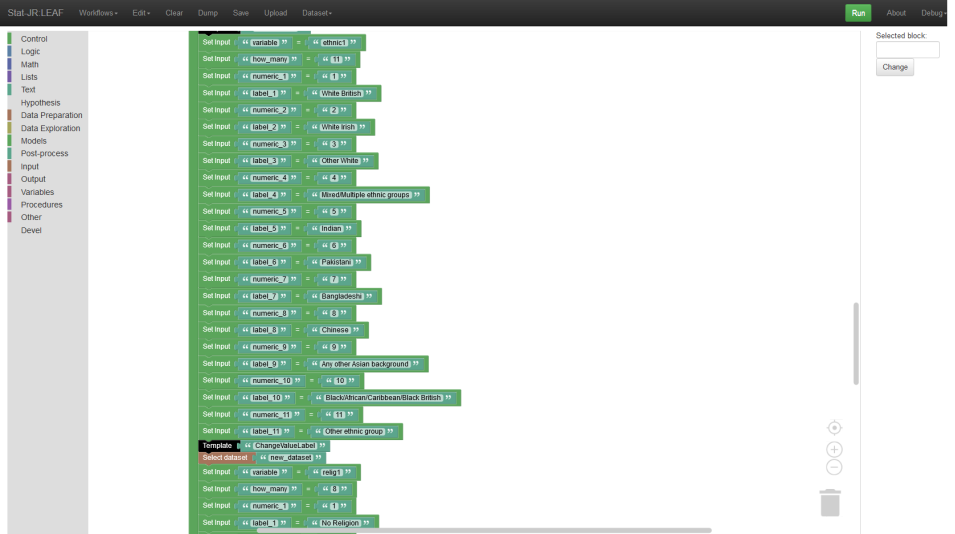
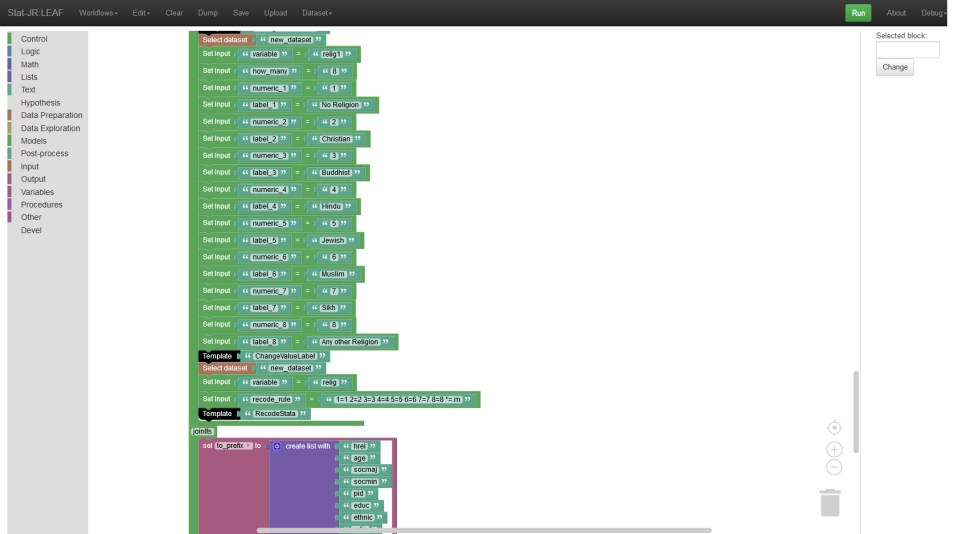
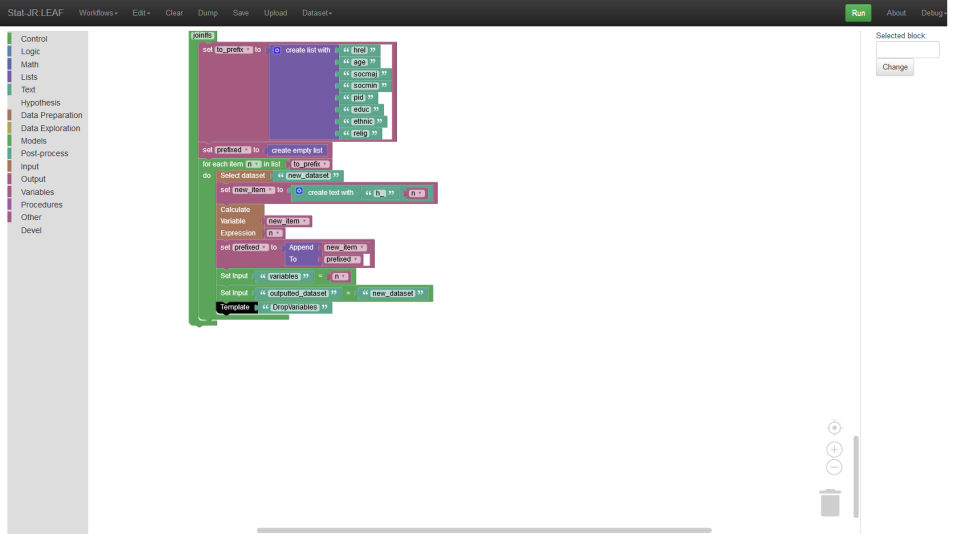
To give you a flavour of what this looks like, below you can see screenshots of one of the Stat-JR workflows we built:
