Case Study: Measuring Segregation Across Districts with Small Population Sizes
This case study - conducted as part of the ESRC grant The use of interactive electronic-books in the teaching and application of modern quantitative methods in the social sciences - was undertaken with the kind involvement of Kelvyn Jones.
Kelvyn is Professor of Human Quantitative Geography at the School of Geographical Sciences at the University of Bristol.
His research interests include:
- the geography of health: in particular geographical inequalities in mortality in advanced economies;
- research design: focusing on how we can develop evidence-based research in non-experimental studies;
- realistically complex modelling: focusing on the quantitative analysis of social-science data with complex structure particularly when there are many levels of analysis.
Introducing the case study
This case study concerns work Kelvyn conducted with Dewi Owen as part of Dewi's PhD in the School of Geographical Sciences.
Their work explored a number of research questions, including whether the UK had become more, or less, equal over the last few years, especially with regard to health outcomes such as early mortality. It has been proposed that some of the more traditional methods used to quantify inequality can be biased, and do not sufficiently take account of the differences that can occur by chance from district-to-district or from time period to time period.
Allied to this Dewi and Kelvyn asked how the government could best distribute public health resources across the UK. Should each area receive the same per head of population, or might some areas need more than others? There has been considerable recent interest in deriving a funding formula to determine how money can be best allocated across geographical area. One suggestion has been to target resources for public health at places which have the biggest problems: for example, allocating more money to areas in which people tend to die younger than average.
Historically, the data on which such decisions were based were available across c.700 geographical units in England and Wales. Now, however, data is available which is much more finely-grained: namely c.7000 units called middle layer super output areas (MSOAs). These areas have been created to be as homogeneous as possible in terms of housing type, and to be roughly the same size in terms of population.
One potential problem with making decisions based on geographical units with such fine granularity, however, is that the overall number of deaths in the relatively young in each area is not very large over a certain time period, and so, by chance, the mortality rates can fluctuate a lot (i.e. there is a large stochastic element).
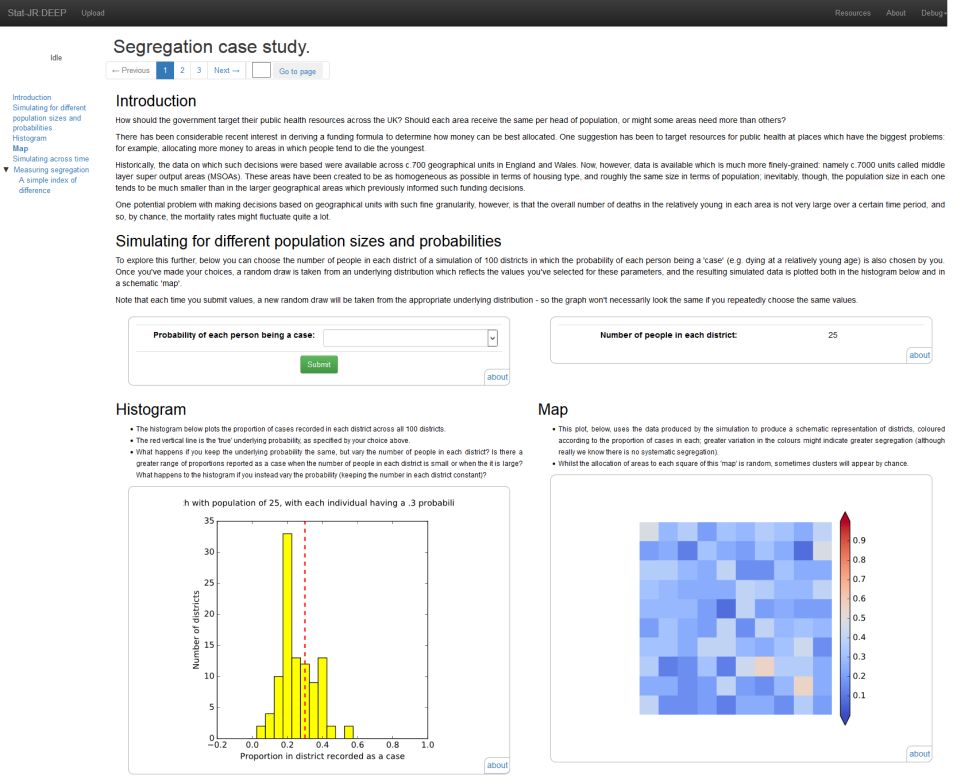
We explored some of these themes via simulations - in a Stat-JR eBook (downloadable, in a zip file containing templates, datasets and an eBook (which in turn contains workflows), via: case_study_segregation_ebook.zip, 41 kb), and in an R shiny interactive resource, allowing comparison between these two methods of rendering content interactive.
To provide a flavour of the content of the Stat-JR eBook, here is a screenshot from the first page:
