Bristol English for Academic Purposes (BEAP) Grammar
5. Supporting Arguments
Reporting Data
Data is used to support ideas in academic writing in a number of ways:
Noun Phrases
Data can often be described using adjective + noun collocations:
|
Adjectives plus slight rapid large sudden sharp dramatic |
Nouns increase decrease rise fall decline reduction |
Prepositional phrases can be used to link ideas:
- a large fall in population
- a slight rise of about 3 per cent.
These noun phrases are often introduced with existential clauses
- There has been a slight increase in the number of football clubs becoming community owned organisations.
- There was a rapid rise in the number of English migrants in Spain between 1990 and 2000.
- There is expected to be a slight decrease in sales over the next financial year.
The indefinite article is typically used to describe data. However, the definite article can be used to refer to something that the reader and writer have a shared understanding of. Compare:
- There has been a slight increase in the tern population.
- The drop in interest rates has had an impact on savings.
Verb Phrases
Data can also be described using intransitive verb + adverb collocations. For example:
| Verbs plus | Adverbs |
|
increase decrease drop rocket fall rise grow shrink contract |
rapidly sharply dramatically slightly steadily gradually suddenly
|
These verb + adverb collocations are often introduced with noun + verb + complement. For example:
- Stock prices fell dramatically yesterday after news emerged of financial fraud in the city.
- As incomes rise gradually, marginal tax rates may also increase.
- The Slovenian economy contracted sharply after independence from Yugoslavia.
Verbs can be linked to ideas with prepositional phrases.
- Economic growth fell by 3% a year between 1887 and 1889.
Comparatives
Data is often structured logically by comparison as facts and figures are compared and contrasted with each other. Comparisons can be made using structures such as more (or -er) ... than or as ... as.
- The German economy has grown more rapidly than any other developed country since the financial crisis of 2008.
- The performance of the SAAB's new engine was just as efficient as the Rolls Royce Merlin V12 engine.
Summary Nouns
A number of nouns may be used to refer to data:
- Statistics
- Verb + statistics: analyse statistics, gather statistics, compile statistics
- Statistics + verb: statistics show, demonstrate, suggest, indicate
- Adjective/noun + statistics: important statistics, latest statistics, official statistics, reliable statistics, government statistics
- Preposition + statistics: According to government/offical statistics
- Evidence
- Verb + evidence: present evidence, gather evidence, obtain evidence, examine evidence, cite evidence
- Evidence + verb: evidence suggests, shows, emerges, grows
- Adjective/noun + evidence: anecdotal evidence, empirical evidence, convincing evidence, crucial evidence, historical evidence
- Evidence + preposition: evidence concerning, about, regarding, against, for.
- Research
- Verb + research: gather research, carry out research, conduct research
- Research + verb: research shows, suggests, demonstrates, reveals
- Adjective/noun + research: original research, in-depth research, empirical research, social research, further research, extensive research
- Research + preposition: Research on, into
- Data
- Verb + data: collect data, gather data, analyse data, access data, retrieve data, interpret data
- Data + verb: data suggests, reveals, indicates, shows
- Adjective/noun + data: accurate, reliable, hard, details, financial, observational, statistical data
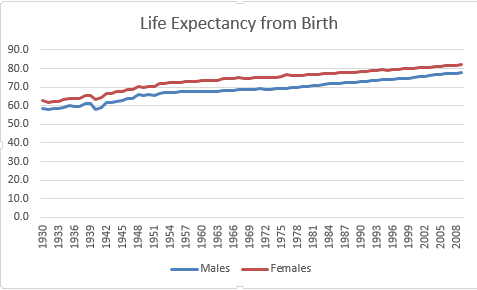
Life expectancy has increased gradually over the last 80 years for both males and females. Life expectancy for females has consistently been higher than for males. Both male and female life expectancy dropped slightly between 1939 and 1942, before recovering by 1945.
Life expectancy has increased gradually over the last 80 years for both males and females. Life expectancy for females has consistently been higher than for males. Both male and female life expectancy dropped dramatically between 1939 and 1942, before recovering by 1945.
Life expectancy has increased rapidly over the last 80 years for both males and females. Life expectancy for females has consistently been higher than for males. Both male and female life expectancy dropped slightly between 1939 and 1942, before recovering by 1945.
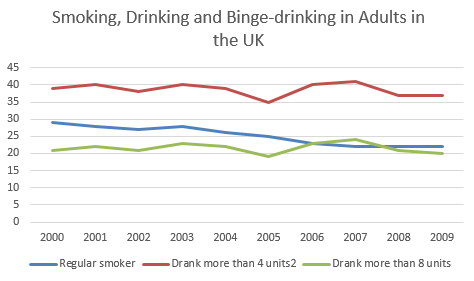
The graph shows the prevalence of smoking , drinking and binge-drinking (ie. drinking too much) in adults in the UK between 2000 and 2009. Rates of drinking fluctuated somewhat over the period, displaying a significant drop in 2005 before recovering then decreasing again slightly. Rates of bring-drinking followed the same pattern as for simply drinking over the period, though at about half the rate. Rates of smoking declined gradually over the period.
The graph shows the prevalence of smoking , drinking and binge-drinking (ie. drinking too much) in adults in the UK between 2000 and 2009. Rates of drinking declined somewhat over the period, displaying a significant drop in 2005 before recovering then decreasing again slightly. Rates of bring-drinking followed the same pattern as for simply drinking over the period, though at about half the rate. Rates of smoking declined gradually over the period.
The graph shows the prevalence of smoking , drinking and binge-drinking (ie. drinking too much) in adults in the UK between 2000 and 2009. Rates of drinking fluctuated somewhat over the period, displaying a significant drop in 2005 before recovering then decreasing again slightly. Rates of bring-drinking followed the same pattern as for simply drinking over the period, though at about half the rate. Rates of smoking declined dramatically over the period.
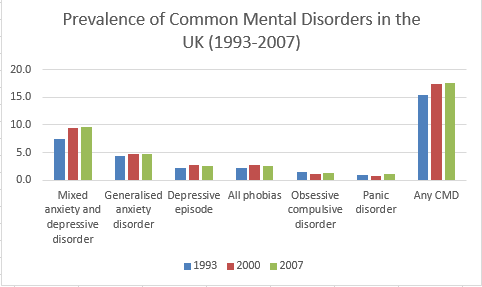
The graph presents the patterns of mental health rates in the UK between 1993 and 2007. Mild anxiety disorder was one of the most commonly reported problems, which rose suddenly over the period, with a particularly dramatic rise between 1993 and 2000. However, while mental health disorders increased overall during the period, reported cases of obsessive compuslive disorder dropped slightly.
The graph presents the patterns of mental health rates in the UK between 1993 and 2007. Mild anxiety disorder was one of the most commonly reported problems, which rose slightly over the period, with a particularly dramatic rise between 1993 and 2000. However, while mental health disorders increased overall during the period, reported cases of obsessive compuslive disorder dropped slightly.
The graph presents the patterns of mental health rates in the UK between 1993 and 2007. Mild anxiety disorder was one of the most commonly reported problems, which rose slightly over the period, with a particularly dramatic rise between 1993 and 2000. However, while mental health disorders increased overall during the period, reported cases of obsessive compuslive disorder dropped remarkably.