Journey times data competition
Traffic congestion is a significant problem in Bristol, substantially affecting quality of life and economic activity. While the increasing popularity of Bristol as a place to live and work is, of course, brilliant news it is likely to put even more pressure on the city’s already stretched transport networks.
What better way of understanding congestion than to use open data? The Jean Golding Institute in collaboration with the Bristol City Council’s Innovation Team organised a jointly challenge to combine data available from Open Data Bristol and external resources to answer questions such as:
- How weather patterns influence traffic load?
- Is there seasonal variation in journey times?
- If car journey times are bad, how does this affect alternative modes of transport?
- Is traffic bad at specific locations at specific times of the day?
- Can congestion data link with sentiment mapping?
- How do large city events / festivals affect congestion?
Journey Times Data competition guidelines (PDF, 93kB)
The Results
The competition closed on the 16th June 2017 with 6 teams submitting entries. The standard of the entries was tremendously high, showing a willingness amongst staff, students, and external collaborators to invest substantial time in this type of data competition. Each team had to have at least one member who was a member of the University of Bristol, but there were three teams who had external members as well (from the University of Bath, UWE, and industry).
The members of the panel judged the entries on the following criteria: focus of work/usefulness, presentation, originality, methodological quality of work, and volume of work. Two runners-up and a winner were unanimously agreed upon.
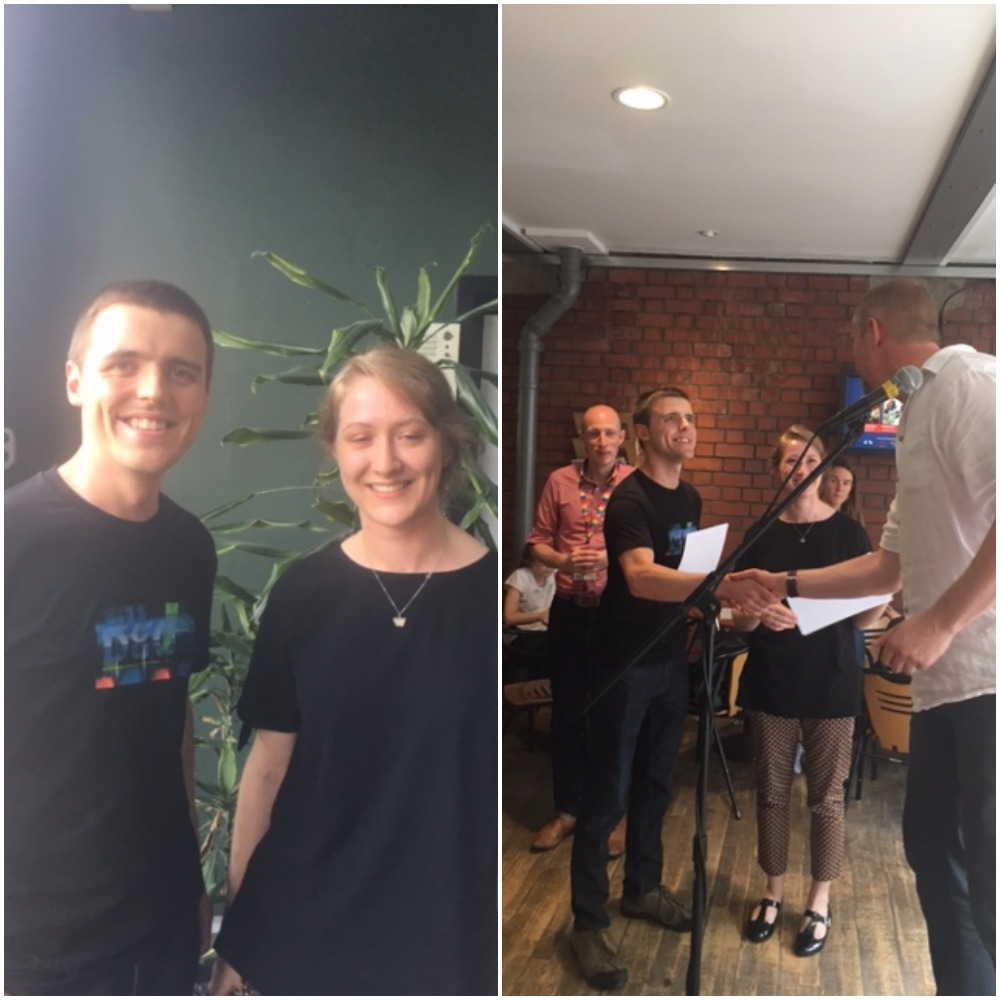
Winner – Kathryn Leeming (School of Mathematics) and Tom Bland (self-employed)
Kathryn and Tom produced a webpage that at a glance allows the user to see the current traffic speeds at each of the locations in the dataset, and compare them with expected speeds based on historical data, while factoring in variables such as time of day etc. The judges felt that this entry was excellent in terms of potential ease of use and were impressed with the process the team had gone through to produce an intuitive and easy to use interface. The team also did some analysis on the data looking at the impact of road races and holidays on traffic flow.
Runner up – Nadia Jalowiecka (Department of Computer Science) and James Williams (University of Bath)
Nadia and James wrote a report and produced Jupyter notebooks as well as interactive google maps. The panel particularly enjoyed the way they related traffic flow to events like coming back from clubs late at night, having a lie in on Saturday mornings and popular football matches at Ashton Gate. They also focussed on the impact of accidents on traffic flow, supplementing the given data with other data sources.
Runner up – Matteo Fasiolo, Sam Livingstone and Ben Powell (School of Mathematics)
The team produced an excellent report along with a key findings document which was greatly appreciated. We felt that their entry was the most technically advanced in terms of the GAM and VAR modelling of traffic flows, but it was also well explained and easy to follow for a less technical audience.
The other 3 entries, again in no particular order, were all commended for their efforts:
Commendation – Caroline Wright (School of Social and Community Medicine) and Greg Chance (University of the West of England)
Caroline and Greg explored traffic flows in Bristol during term-time and school holidays. They produced a clear report containing useful insights on the impact of the school year on traffic in Bristol. A particularly nice feature of this report was the addition of air quality data, yielding some insights into how air quality in the city is affected by different traffic flows.
Commendation – Kacper Sokol (Department of Computer Science)
Kacper’s report was shaped as a reveal.js online presentation, which was particularly suitable for his approach given the emphasis on graphs in his work. Kacper looked at a broad set of variables influencing traffic patterns in Bristol, e.g. weather, time-of-day, large city events, road accidents, etc. The insights from these analyses are presented in elegant interactive 2d graphs, where hovering over parts of the graphs reveals supplementary information.
Commendation – Natalie Thurlby (Department of Computer Science), Emily Pole (Bristol Centre for Functional Nano Materials), Pietro Carnelli (Department of Mechanical Engineering), and Alonso Espinosa (Bristol Centre for Complexity Sciences)
Natalie, Emily, Pietro, and Alonso used three different datasets (i.e. collisions data, events data, and the mandatory journey times data) to paint an overall picture of the problem of traffic congestion in Bristol. The team cleverly used statistical methods to identify clustering in the data (e.g. PCA and k-means clustering to identify clusters of traffic behaviour over the weekdays) and generated beautiful graphs and maps with thought-through colour coding to demonstrate their insights.
Next Steps
The Jean Golding Institute will be working with the participants to prepare a publication of the results, also we continue working with the Innovation team at Bristol City Council to identify other challenges in Bristol that would benefit from this approach.
Winner – Kathryn Leeming (School of Mathematics) and Tom Bland (self-employed)
Runner up – Nadia Jalowiecka (Department of Computer Science) and James Williams (University of Bath)
Runner up – Matteo Fasiolo, Sam Livingstone and Ben Powell (School of Mathematics)